
Infographic
Infographic

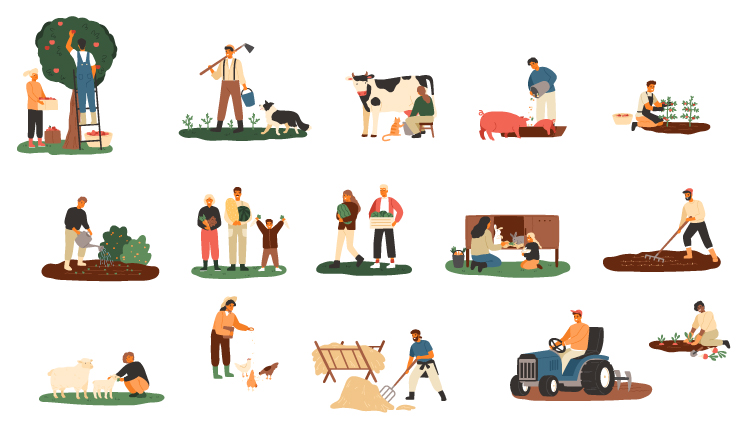
A look at agricultural workers in 2022
Infographic
The number of agriculture employees in Canada reached 278,373 in 2022, up 0.5% from 2021.
Fewer active businesses in November 2023, as the decline in openings outpaced that of closures

Infographic
The business opening rate dropped from 4.5% in October to 4.1% in November. The business closure rate also fell, down 0.2 percentage points to 4.5%. As there were more business closures than openings, the number of active businesses declined, down for the third consecutive month.
Fewer active businesses in October as openings decrease

Infographic
The number of active businesses fell by 0.2% (-1,986) in October, its third decline in four months. This decrease was driven by the 0.4 percentage-point drop in the opening rate (4.2%), as the closure rate remained relatively unchanged at 4.8%.
Food and drinking places sales decline in August in the wake of wildfires

Infographic
Sales at food and drinking places fell 1.0% to $7.7 billion in August, with most of the decline attributable to lower sales at full-service (-1.2% to $3.4 billion) and limited-service (-0.7% to $3.5 billion) restaurants.
Possible effects of the British Columbia port strike on Canada’s international merchandise trade: An explainer

Infographic
In July, workers at British Columbia marine terminals were on strike for more than 13 days. This likely impacted Canada’s international merchandise trade. See our infographic for more details.
It’s BBQ season!

Infographic
Where there’s a grill there’s a way. How much more (or less!) does everything cost for your backyard BBQ this summer?
Specialty food services fall for the first time since November 2022

Infographic
On a seasonally adjusted basis, sales at drinking places (+3.5%) and limited-service restaurants (+0.7%), such as fast-food joints and coffee shops, were up in May.
Food services and drinking places, April 2023

Infographic
This infographic highlights a variety of statistics on restaurants, bars and caterers in Canada and selected provinces and territories.