

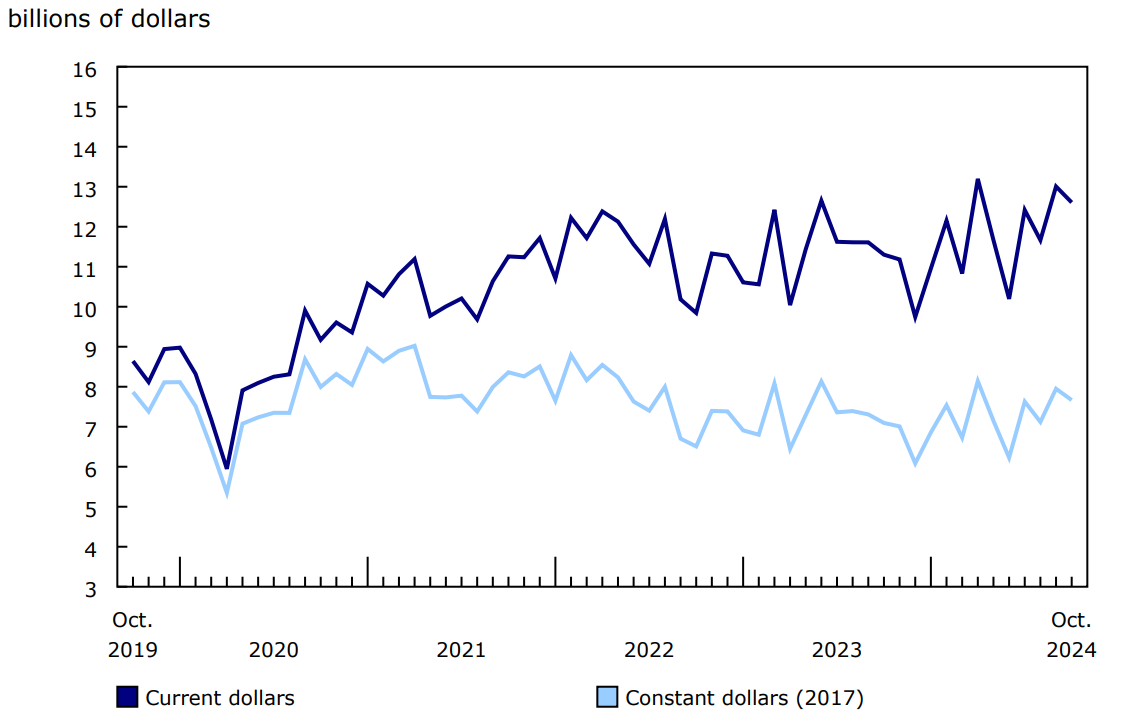
The total value of building permits issued in Canada decreased by $399.1 million (-3.1%) to $12.6 billion in October. This comes on the heels of a strong September, during which construction intentions rose by $1.3 billion to the second-highest level in the series. Despite the monthly decline in October, the total value of building permits was the fourth-highest level in the series. In October, Ontario's construction intentions (-$696.4 million) significantly contributed to the national non-residential decline, tempering total residential growth, after fuelling both sectors' gains in September.
On a constant dollar basis (2017=100), the total value of building permits in October decreased 3.6% from the previous month and was up 8.1% on a year-over-year basis.
Chart 1: Total value of building permits, seasonally adjusted
Description - Chart 1
Data table: Total value of building permits, seasonally adjusted
Source: Table 34-10-0285-01.
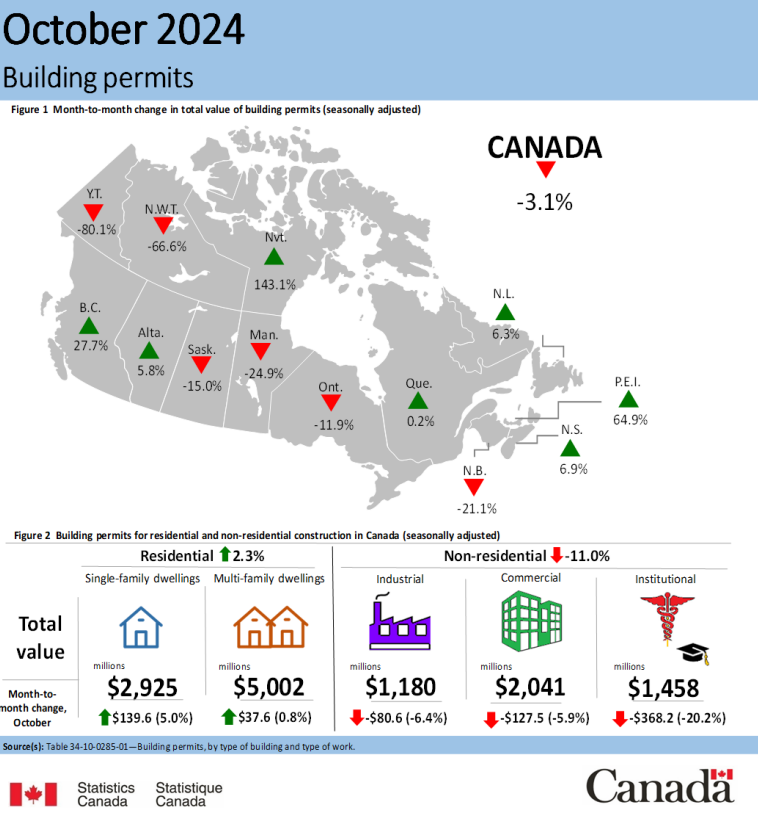
Infographic 1: Building permits, October 2024
Description - Infographic 1
Infographic description:
The title of the infographic is "Building permits, October 2024"
The infographic includes multiple components, such as a map, tables, pictographs and images.
Text in the infographic and the map data are as follows:
Figure 1: Month-to-month change in total value of building permits (seasonally adjusted).
This is a map of Canada by province and territory that shows the month-to-month percentage changes of the total building permits value. Green arrows represent an increase, while red arrows represent a decrease.
Building permit values in Canada were down 3.1% in October compared with September. Newfoundland and Labrador was up 6.3%, Prince Edward Island was up 64.9%, Nova Scotia was up 6.9%, New Brunswick was down 21.1%, Quebec was up 0.2%, Ontario was down 11.9%, Manitoba was down 24.9%, Saskatchewan was down 15.0%, Alberta was up 5.8%, British Columbia was up 27.7%, Yukon was down 80.1%, Northwest Territories was down 66.6% and Nunavut was up 143.1%.
Figure 2: Building permits for residential and non-residential construction in Canada (seasonally adjusted).
Residential: The total value was up 2.3% month over month.
Non-residential: The total value was down 11.0% month over month.
Single-family dwellings: the total value was $2,925 million, representing a month-over-month increase of 5.0% or $139.6 million.
Multi-family dwellings: the total value was $5,002 million, representing a month-over-month increase of 0.8% or $37.6 million.
Industrial: the total value was $1,180 million, representing a month-over-month decrease of 6.4% or $80.6 million.
Commercial: the total value was $2,041 million, representing a month-over-month decrease of 5.9% or $127.5 million.
Institutional: the total value was $1,458 million, representing a month-over-month decrease of 20.2% or $368.2 million.
Source: Table 34-10-0285-01
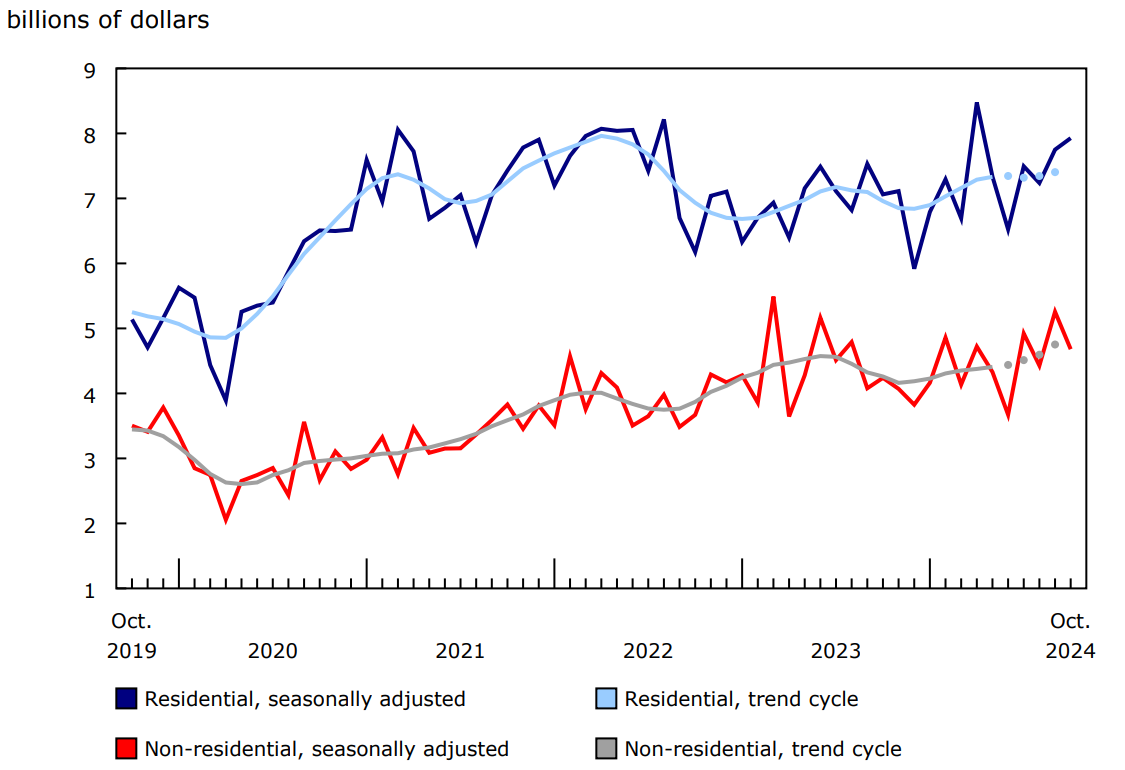
Declines in Ontario and Manitoba construction intentions push down the non-residential sector
The total value of non-residential building permits decreased by $576.3 million (-11.0%) to $4.7 billion in October, led by Ontario (-$300.9 million) and Manitoba (-$207.5 million). Overall, declines were seen across the institutional (-$368.2 million), commercial (-$127.5 million) and industrial (-$80.6 million) components.
Ontario's non-residential sector decrease in October was driven by the institutional component (-$241.9 million), following the province's record-high level reached in September. Manitoba's decrease was driven by the industrial component (-$141.0 million) in October.
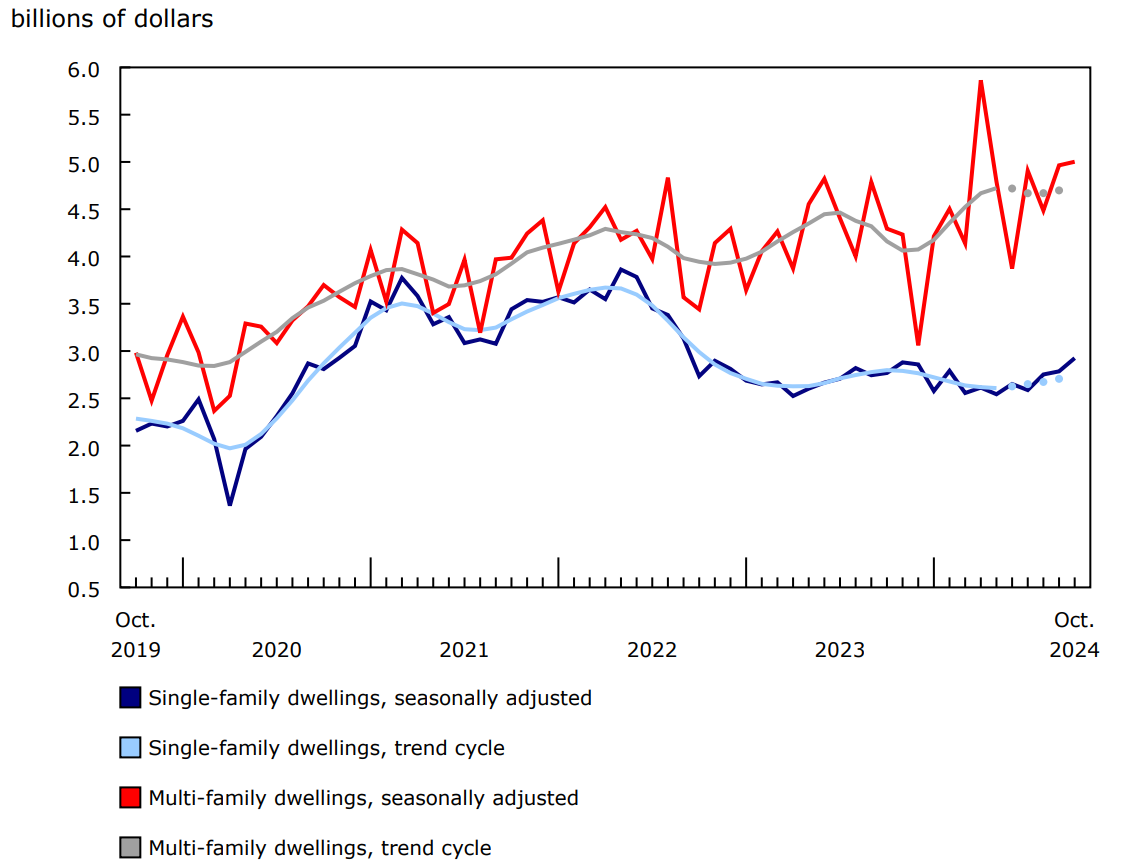
Chart 2: Value of building permits for the single-family and multi-family components
Description - Chart 2
Data table: Value of building permits for the single-family and multi-family components
Note: The higher variability associated with the trend-cycle estimates is indicated with a dotted line on the chart for the current reference month and the previous three months. For more information, see the Note to readers.
Source: Table 34-10-0285-01.
Chart 3: Value of building permits for the residential and non-residential sectors
Description - Chart 3
Data table: Value of building permits for the residential and non-residential sectors
Note: The higher variability associated with the trend-cycle estimates is indicated with a dotted line on the chart for the current reference month and the previous three months. For more information, see the Note to readers.
Source: Table 34-10-0285-01.
British Columbia and Alberta lead residential growth, while Ontario multi-family dwellings temper national gain
Residential construction intentions increased by $177.1 million (+2.3%) to $7.9 billion in October. British Columbia (+$275.6 million) and Alberta (+$158.9 million) led residential sector growth, which was also supported by Nova Scotia (+$73.7 million) and Manitoba (+$61.3 million).
The multi-family component edged up by $37.6 million in October. Monthly gains were observed in seven provinces and one territory, led by British Columbia (+$261.4 million) and Alberta (+$129.8 million). The gains were tempered by a decline in Ontario (-$472.8 million), following a sharp increase driven by several large multi-family dwellings construction projects in September. British Columbia's increase in October was supported by a large multi-family dwelling construction project in Burnaby, while Alberta's expansion was broad-based.
The value of single-family permits rose by $139.6 million in October, driven by Ontario (+$77.3 million), which was also supported by contributions from seven other provinces and territories.
Across Canada, 21,300 new multi-family dwellings and 4,900 single-family dwellings were authorized in October, representing a 6.7% monthly increase in the total number of units approved for construction through permit issuance. The 12-month cumulative total of units authorized from November 2023 to October 2024 rose by 2.7% to 274,100, compared with 266,800 units authorized from November 2022 to October 2023.
To explore data using an interactive user interface, visit the Building permits: Interactive Dashboard.
For more information on construction, please visit the Construction statistics portal.
For more information on housing, please visit the Housing statistics portal.
Note to readers
Unless otherwise stated, this release presents seasonally adjusted data with current dollar values, which facilitate month-to-month and quarter-to-quarter comparisons by removing the effects of seasonal variations. For information on seasonal adjustment, see Seasonally adjusted data – Frequently asked questions.
For information on trend-cycle data, see the page Trend-cycle estimates – Frequently asked questions.
Data may not add up to totals as a result of rounding.
Building components
- Single-family dwellings: Residential buildings containing only one dwelling unit (e.g., single-detached house, bungalow, linked home [linked at the foundation]).
- Multi-family dwellings: Residential buildings containing multiple dwelling units (e.g., apartment, apartment condominium, row house, semi-detached house).
- Industrial buildings: Buildings used in the processing or production of goods or related to transportation and communication.
- Commercial buildings: Buildings used in the trade or distribution of goods and services, including office buildings.
- Institutional and government buildings: Buildings used to house public and semi-public services, such as those related to health and welfare, education or public administration, and buildings used for religious services.
Revision
Data are subject to revisions based on late responses, methodological changes and classification updates. Unadjusted data have been revised for the previous month. Seasonally adjusted data have been revised for the previous three months.
Reference
Data table: 34-10-0285-01.
- Note: some data tables may best be viewed on desktop.
Definitions, data sources and methods: survey number 2802.
Previous release: Building permits, September 2024.
Next release: January 10, 2025.
Contact information
For more information, or to enquire about the concepts, methods or data quality of this release, contact us (toll-free 1-800-263-1136; 514-283-8300; infostats@statcan.gc.ca) or Media Relations (statcan.mediahotline-ligneinfomedias.statcan@statcan.gc.ca).