

Job vacancies decline in the third quarter, but at a slower pace
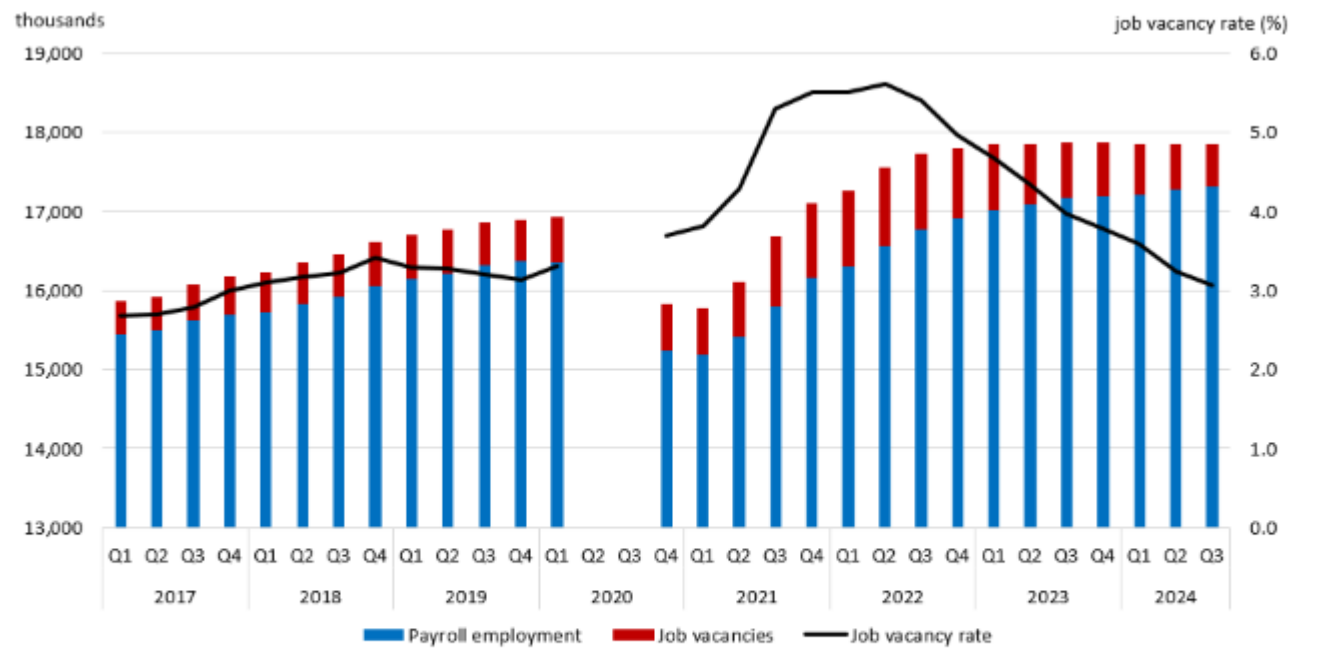
Job vacancies fell by 31,900 (-5.5%) to 546,100 in the third quarter, marking the ninth consecutive quarterly decline. However, the drop in the third quarter was smaller compared with the decline recorded in the second quarter of 2024 (-63,200; -9.9%).
In the third quarter, job vacancies declined for both permanent (-27,800; -5.9%) and temporary (-4,100; -4.0%) positions, and among both full-time (-19,300; -4.5%) and part-time (-12,600; -8.5%) positions.
Meanwhile, total labour demand (the sum of filled and vacant positions) was little changed for the fourth consecutive quarter. On a year-over-year basis, total labour demand was down by 0.1% in the third quarter. This follows year-over-year growth of 0.8% in the third quarter of 2023, and 6.3% in the third quarter of 2022.
The job vacancy rate—which corresponds to the number of vacant positions as a proportion of total labour demand—decreased 0.1 percentage points to 3.1% in the third quarter of 2024, marking the ninth consecutive quarterly decline from a record high of 5.6% in the second quarter of 2022.
The unemployment-to-job vacancy ratio—the number of unemployed persons per job vacancy—continued a steady increase to 2.6 in the third quarter of 2024, up from 2.4 in the second quarter, and from 2.0 in the first quarter. The increase in the unemployment-to-job vacancy ratio from the third quarter of 2022 reflected both a decrease in job vacancies (-410,500; -43.0%) and an increase in the number of unemployed persons (+374,200; +35.5%, according to the Labour Force Survey). The unemployment-to-job vacancy ratio excludes the territories for consistency with the available Labour Force Survey data.
Chart 1: Job vacancies and job vacancy rate continue their downward trend
Description - Chart 1
The title of the infographic is "Job vacancies and job vacancy rate continue their downward trend"
This is a linear and bar combination chart.
The vertical axis on the left shows the number of job vacancies and number of payroll employment in thousands, by increments of 1,000. It starts at 13,000 and ends at 19,000.
The vertical axis on the right shows the job vacancy rate by percentage, by increments of 1 percentage point. It starts at 0.0 and ends at 6.0.
The horizontal axis shows each quarter, from the first quarter of 2017 to the third quarter of 2024.
The dark red bar represents the number of job vacancies (in thousands) in the last 31 quarters, with 426.6 in the first quarter of 2017, 430.7 in the second quarter of 2017, 447.8 in the third quarter of 2017, 485.1 in the fourth quarter of 2017, 501.6 in the first quarter of 2018, 516.8 in the second quarter of 2018, 530.8 in the third quarter of 2018, 566.4 in the fourth quarter of 2018, 550.8 in the first quarter of 2019, 548.3 in the second quarter of 2019, 540.5 in the third quarter of 2019, 530.6 in the fourth quarter of 2019, 560.3 in the first quarter of 2020, second and third quarter of 2020 was omitted because data were not collected during this phase of the COVID-19 pandemic, 584.6 in the fourth quarter of 2020, 602.5 in the first quarter of 2021, 690.3 in the second quarter of 2021, 883.9 in the third quarter of 2021, 940.1 in the fourth quarter of 2021, 948.2 in the first quarter of 2022, 983.6 in the second quarter of 2022, 958.0 in the third quarter of 2022, 882.8 in the fourth quarter of 2022, 834.5 in the first quarter of 2023, 775.5 in the second quarter of 2023, 708.7 in the third quarter of 2023, 674.3 in the fourth quarter of 2023, 641.1 in the first quarter of 2024, 578.0 in the second quarter of 2024, and 546.1 in the third quarter of 2024.
The blue bar represents the payroll employment (in thousands) in the last 31 quarters, with 15,437.2 in the first quarter of 2017, 15,489.6 in the second quarter of 2017, 15,628.2 in the third quarter of 2017, 15,685.9 in the fourth quarter of 2017, 15,728.3 in the first quarter of 2018, 15,837.0 in the second quarter of 2018, 15,923.1 in the third quarter of 2018, 16,050.5 in the fourth quarter of 2018, 16,146.1 in the first quarter of 2019, 16,216.3 in the second quarter of 2019, 16,312.2 in the third quarter of 2019, 16,364.5 in the fourth quarter of 2019, 16,360.2 in the first quarter of 2020, second and third quarter of 2020 was omitted because data were not collected during this phase of the COVID-19 pandemic, 15,237.9 in the fourth quarter of 2020, 15,182.1 in the first quarter of 2021, 15,418.1 in the second quarter of 2021, 15,797.2 in the third quarter of 2021, 16,153.2 in the fourth quarter of 2021, 16,305.8 in the first quarter of 2022, 16,566.7 in the second quarter of 2022, 16,767.7 in the third quarter of 2022, 16,909.4 in the fourth quarter of 2022, 17,012.3 in the first quarter of 2023, 17,082.4 in the second quarter of 2023, 17,164.9 in the third quarter of 2023, 17,194.2 in the fourth quarter of 2023, 17,213.5 in the first quarter of 2024, 17,275.2 in the second quarter of 2024, and 17,302.4 in the third quarter of 2024.
The black line represents the job vacancy rate (in percentage) in the last 31 quarters, with 2.7% in the first quarter of 2017, 2.7% in the second quarter of 2017, 2.8% in the third quarter of 2017, 3.0% in the fourth quarter of 2017, 3.1% in the first quarter of 2018, 3.2% in the second quarter of 2018, 3.2% in the third quarter of 2018, 3.4% in the fourth quarter of 2018, 3.3% in the first quarter of 2019, 3.3% in the second quarter of 2019, 3.2% in the third quarter of 2019, 3.1% in the fourth quarter of 2019, 3.3% in the first quarter of 2020, second and third quarter of 2020 was omitted because data were not collected during this phase of the COVID-19 pandemic, 3.7% in the fourth quarter of 2020, 3.8% in the first quarter of 2021, 4.3% in the second quarter of 2021, 5.3% in the third quarter of 2021, 5.5% in the fourth quarter of 2021, 5.5% in the first quarter of 2022, 5.6% in the second quarter of 2022, 5.4% in the third quarter of 2022, 5.0% in the fourth quarter of 2022, 4.7% in the first quarter of 2023, 4.3% in the second quarter of 2023, 4.0% in the third quarter of 2023, 3.8% in the fourth quarter of 2023, 3.6% in the first quarter of 2024, 3.2% in the second quarter of 2024, and 3.1% in the third quarter of 2024.
Note: Total labour demand is equal to the sum of payroll employment and job vacancies. Job Vacancy and Wage Survey data collection was suspended for the second and third quarters of 2020. Therefore, data for these reference periods are not available. Data are seasonally adjusted.
Source: Job Vacancy and Wage Survey (5217), table 14-10-0400-01.
Job vacancies down in four broad occupational groups
In the third quarter of 2024, job vacancies fell in 4 of the 10 broad occupational groups, led by sales and service occupations (-12,500; -7.4%), health occupations (-8,200; -9.5%), trades, transport and equipment operators and related occupations (-6,900; -6.6%), and occupations in manufacturing and utilities (-3,100; -16.1%). Legislative and senior management occupations (+200; +16.2%) was the only broad occupational group to see an increase in job vacancies in the third quarter. Vacancies were little changed in the remaining five broad occupational groups.
Sales and service occupations continue to drive decline in overall vacancies
Job vacancies in sales and service occupations declined for the eighth consecutive quarter, falling by 12,500 (-7.4%) to 155,300 in the third quarter. Despite the decline, sales and service occupations continued to represent the largest share of vacancies among all 10 broad occupational groups, accounting for nearly 3 in 10 (28.4%) vacancies in the third quarter.
Year over year, job vacancies in sales and service occupations declined by 71,400 (-29.8%) in the third quarter. Within this occupational group, food counter attendants, kitchen helpers and related support occupations (-17,300 to 30,100), retail salespersons and visual merchandisers (-10,100 to 20,000), cooks (-6,000 to 13,800), and light duty cleaners (-5,100 to 9,000) saw the largest year-over-year drops in vacancies in the third quarter (not seasonally adjusted).
Trades, transport and equipment operators and related occupations hits ninth consecutive quarterly decline in job vacancies
In the third quarter, job vacancies decreased by 6,900 (-6.6%) to 98,400 in trades, transport and equipment operators and related occupations. This was the ninth consecutive quarterly decline observed since the record high (195,000) reached in the second quarter of 2022.
On a year-over-year basis, the number of vacant positions in trades, transport and equipment operators and related occupations was down by 43,100 (-28.5%) in the third quarter of 2024. The largest decreases were recorded for transport truck drivers (-7,000 to 13,200), construction trades helpers and labourers (-6,000 to 12,300), carpenters (-4,400 to 4,600), and automotive service technicians, truck and bus mechanics and mechanical repairers (-3,300 to 6,300) (not seasonally adjusted).
Job vacancies in health occupations decline two quarters in a row
Job vacancies in health occupations fell by 8,200 (-9.5%) to 78,600 in the third quarter, following a decrease of 5,400 (-5.8%) in the second quarter. This was the second consecutive quarterly decline after six consecutive quarters of little change since the peak in the third quarter of 2022, when job vacancies in health occupations reached 97,400.
Year over year, vacancies in health occupations were down by 13,900 (-14.9%) in the third quarter of 2024. Among health occupations, registered nurses and registered psychiatric nurses (-6,400 to 23,900), nurse aides, orderlies and patient service associates (-3,500 to 17,200), and licensed practical nurses (-2,500 to 10,600) accounted for the largest year-over-year decreases. These three occupational groupings together accounted for nearly two-thirds (64.8%) of the total vacancies in health occupations (not seasonally adjusted).
Average offered hourly wage grows at a faster pace in the third quarter
On a year-over-year basis, the average offered hourly wage grew at a faster pace in the third quarter (+7.6% to $27.55) compared with the second quarter (+6.8% to $26.80) and the first quarter (+7.3% to $27.25). In comparison, year-over-year average hourly wages of all employees (from the Labour Force Survey) grew 5.0% in the third quarter (data used in this section are not seasonally adjusted).
These wage increases were due in part to a shift in the relative composition of job vacancies from occupations offering lower wages to those offering higher wages. Using a method that holds the composition of job vacancies by occupation at the third quarter of 2023, average offered hourly wages grew by 5.0% on a year-over-year basis in the third quarter of 2024, up from 4.2% in the second quarter.
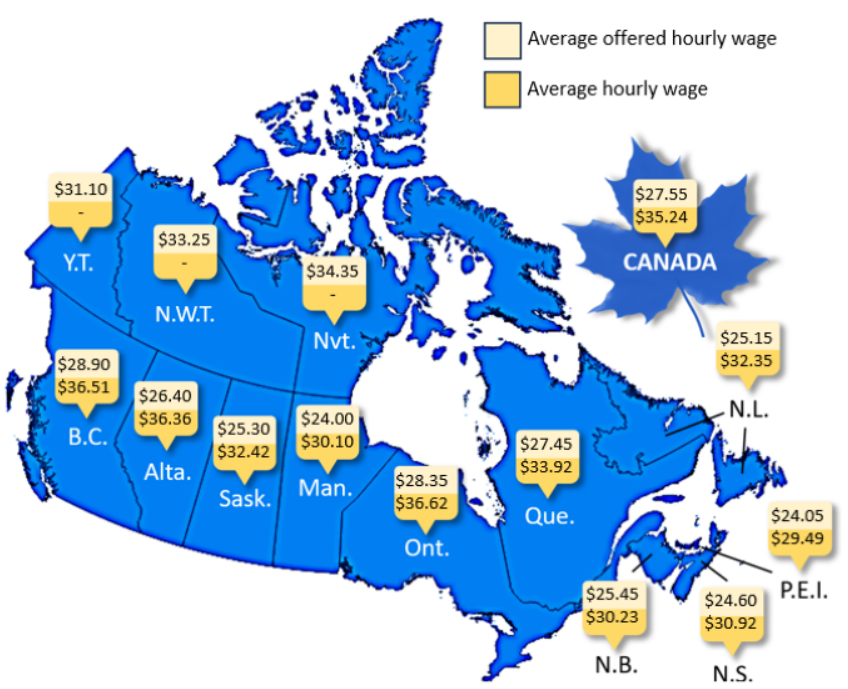
Map 1 : Average offered hourly wage and average hourly wage by province and territory, third quarter of 2024
Description - Map 1
The title of the map is "Average offered hourly wage and average hourly wage by province and territory, third quarter of 2024"
This is a map of Canada by province and territory showing average offered hourly wage and average hourly wage in the third quarter of 2024.
The average offered hourly wage in Canada was $27.55 and the average hourly wage was $35.24 in the third quarter of 2024.
The average offered hourly wage in Newfoundland and Labrador was $25.15 and the average hourly wage was $32.35 in the third quarter of 2024.
The average offered hourly wage in Prince Edward Island was $24.05 and the average hourly wage was $29.49 in the third quarter of 2024.
The average offered hourly wage in Nova Scotia was $24.60 and the average hourly wage was $30.92 in the third quarter of 2024.
The average offered hourly wage in New Brunswick was $25.45 and the average hourly wage was $30.23 in the third quarter of 2024.
The average offered hourly wage in Quebec was $27.45 and the average hourly wage was $33.92 in the third quarter of 2024.
The average offered hourly wage in Ontario was $28.35 and the average hourly wage was $36.62 in the third quarter of 2024.
The average offered hourly wage in Manitoba was $24.00 and the average hourly wage was $30.10 in the third quarter of 2024.
The average offered hourly wage in Saskatchewan was $25.30 and the average hourly wage was $32.42 in the third quarter of 2024.
The average offered hourly wage in Alberta was $26.40 and the average hourly wage was $36.36 in the third quarter of 2024.
The average offered hourly wage in British Columbia was $28.90 and the average hourly wage was $36.51 in the third quarter of 2024.
The average offered hourly wage in Yukon was $31.10 in the third quarter of 2024.
The average offered hourly wage in Northwest Territories was $33.25 in the third quarter of 2024.
The average offered hourly wage in Nunavut was $34.35 in the third quarter of 2024.
Note: Data are not seasonally adjusted. The average offered hourly wage (JVWS) excludes overtime, tips, commissions and bonuses. Average hourly wages (LFS) include tips and commissions. The offered wage may be different from the actual wage paid once the position is filled. All wages are before taxes and deductions. LFS does not report average hourly wages for the territories.
Source: Job Vacancy and Wage Survey (JVWS) (5217), table 14-10-0444-01; Labour Force Survey (LFS) (3701), table 14-10-00063-01.
Largest decline in vacancies for positions requiring a high school diploma or less
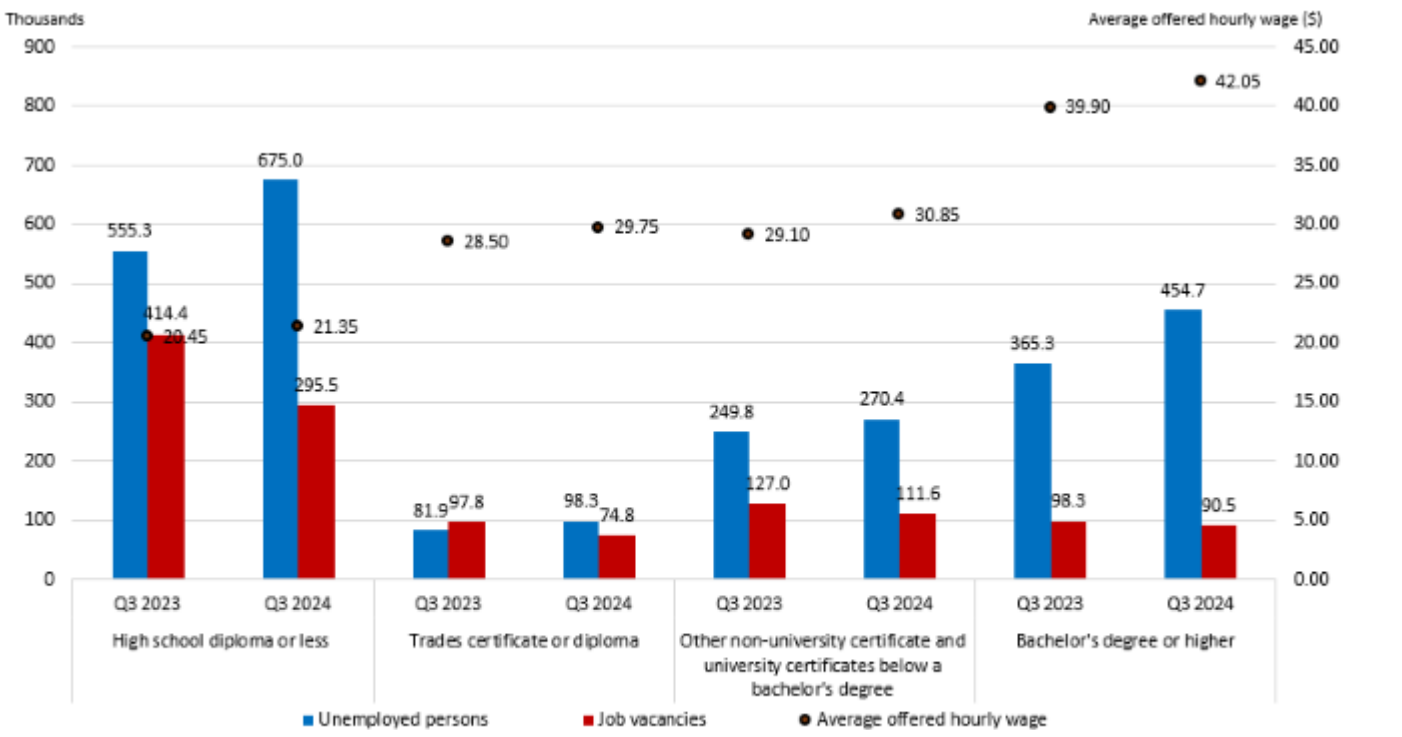
Compared with a year earlier, there were fewer vacant positions for all educational levels sought by employers in the third quarter, with positions requiring a high school diploma or less (-118,900; -28.7%) recording the largest decline. More than half (57.9%) of the decline in vacant positions requiring a high school diploma or less were accounted for by sales and service occupations (-68,800; -33.0%) (not seasonally adjusted).
Chart 2: Positions requiring high school diploma or less continue to account for the largest share of the total decline in job vacancies
Description - Chart 2
The title of the infographic is "Positions requiring high school diploma or less continue to account for the largest share of the total decline in job vacancies"
This is a scatter and bar combination chart.
The vertical axis on the left shows the number of unemployed persons (blue bar) and job vacancies (dark red bar) in thousands by increments of 100. It starts at 0 and ends at 900.
The vertical axis on the right shows the average offered hourly wages in dollars, by increments of $5.00. It starts at $0.00 and ends at $45.00.
The horizontal axis shows the third quarter of 2023 and the third quarter of 2024 for each selected educational group: high school diploma or less, trades certificate or diploma, other non-university certificate and university certificates below a bachelor's degree, and bachelor's degree or higher.
The first blue bar represents the third quarter of 2023 for unemployed persons holding high school diploma or less, with the number of unemployed persons at 555.3.
The second blue bar represents the third quarter of 2024 for unemployed persons holding high school diploma or less, with the number of unemployed persons at 675.0.
The third blue bar represents the third quarter of 2023 for unemployed persons holding trades certificate or diploma, with the number of unemployed persons at 81.9.
The fourth blue bar represents the third quarter of 2024 for unemployed persons holding trades certificate or diploma, with the number of unemployed persons at 98.3.
The fifth blue bar represents the third quarter of 2023 for unemployed persons holding other non-university certificate and university certificates below a bachelor's degree, with the number of unemployed persons at 249.8.
The sixth blue bar represents the third quarter of 2024 for unemployed persons holding other non-university certificate and university certificates below a bachelor's degree, with the number of unemployed persons at 270.4.
The seventh blue bar represents the third quarter of 2023 for unemployed persons holding bachelor's degree or higher, with the number of unemployed persons at 365.3.
The eighth blue bar represents the third quarter of 2024 for unemployed persons holding bachelor's degree or higher, with the number of unemployed persons at 454.7.
The first dark red bar represents the third quarter of 2023 for job vacancies requiring high school diploma or less, with job vacancies at 414.4. The average offered hourly wage for this group was $20.45 in the third quarter of 2023.
The second dark red bar represents the third quarter of 2024 for job vacancies requiring high school diploma or less, with job vacancies at 295.5. The average offered hourly wage was $21.35 in the third quarter of 2024.
The third dark red bar represents the third quarter of 2023 for job vacancies requiring trades certificate or diploma, with job vacancies at 97.8. The average offered hourly wage for this group was $28.50 in the third quarter of 2023.
The fourth dark red bar represents the third quarter of 2024 for job vacancies requiring trades certificate or diploma, with job vacancies at 74.8. The average offered hourly wage for this group was $29.75 in the third quarter of 2024.
The fifth dark red bar represents the third quarter of 2023 for job vacancies requiring other non-university certificate and university certificates below a bachelor's degree, with job vacancies at 127.0. The average offered hourly wage for this group was $29.10 in the third quarter of 2023.
The sixth dark red bar represents the third quarter of 2024 for job vacancies requiring other non-university certificate and university certificates below a bachelor's degree, with job vacancies at 111.6. The average offered hourly wage for this group was $30.85 in the third quarter of 2024.
The seventh dark red bar represents the third quarter of 2023 for job vacancies requiring bachelor's degree or higher, with job vacancies at 98.3. The average offered hourly wage for this group was $39.90 in the third quarter of 2023.
The eighth dark red bar represents the third quarter of 2024 for job vacancies requiring bachelor's degree or higher, with job vacancies at 90.5. The average offered hourly wage for this group was $42.05 in the third quarter of 2024.
Note: Data are not seasonally adjusted.
Source: Job Vacancy and Wage Survey (5217), table 14-10-0443-01; Labour Force Survey (3701), table 14-10-0019-01.
Fewer job vacancies in 20 of 69 economic regions
In the third quarter, job vacancies decreased in Ontario (-16,500 to 184,400), Quebec (-5,900 to 121,300), Saskatchewan (-1,900 to 17,900), Manitoba (-1,100 to 21,200), Nova Scotia (-1,000 to 14,600), Newfoundland and Labrador (-500 to 5,300), the Northwest Territories (-300 to 1,100), and Yukon (-200 to 800). Job vacancies held steady in the other provinces and in Nunavut.
At the regional level, job vacancies were down in 20 of 69 economic regions in the third quarter. The largest declines were concentrated in Ontario, including Toronto (-5,900 to 91,500); Kitchener–Waterloo–Barrie (-3,800 to 16,300); and Hamilton–Niagara Peninsula (-2,900 to 16,100). Increases in job vacancies were recorded in three regions, all in Quebec: Laval (+700 to 4,100); Côte-Nord and Nord-du-Québec (+600 to 3,000); and Gaspésie–Îles-de-la-Madeleine (+300 to 1,100). Vacancies were little changed in the other 46 economic regions.
Note to readers
The Job Vacancy and Wage Survey (JVWS) provides comprehensive data on job vacancies and offered wages by industrial sector and detailed occupation for Canada and the provinces, territories and economic regions. Additional information is also available by occupation, such as the proportion of job vacancies for full-time and part-time positions, the duration of job vacancies, the levels of education and experience sought for the job, and other characteristics. Job vacancy, offered wage, and vacancy characteristics data are released quarterly.
Estimates by sector are based on the North American Industry Classification System 2022 Version 1.0. Estimates by geographical area are based on the Standard Geographical Classification 2021. Estimates by occupation reflect the National Occupational Classification (NOC) 2021 Version 1.0. The NOC is a five-tiered hierarchical structure of occupational groups with successive levels of disaggregation. The structure is as follows: (1) 10 broad occupational categories, also referred to as one-digit NOC; (2) 45 major groups, also referred to as two-digit NOC; (3) 89 sub-major groups, also referred to as three-digit NOC; (4) 162 minor groups, also referred to as four-digit NOC; and (5) 516 unit groups, also referred to as five-digit NOC.
Because of the COVID-19 pandemic, data collection for the JVWS was suspended for the second and third quarters of 2020.
Preliminary monthly estimates are produced for job vacancies and job vacancy rates by province and by industrial sector. These preliminary monthly estimates are released on a monthly basis with the estimates from Survey of Employment, Payrolls and Hours. More information about the concepts and use of data from the JVWS is available in the Guide to the Job Vacancy and Wage Survey (75-514-G).
The target population of the survey includes all business locations in Canada, excluding those involved primarily in religious organizations and private households. Federal, provincial, and territorial, as well as international and other extraterritorial public administrations, are also excluded from the survey.
Unless otherwise stated, this release presents seasonally adjusted estimates, which facilitate comparisons by removing the effects of seasonal variations. For more information on seasonal adjustment, see Seasonally adjusted data – Frequently asked questions.
Seasonally adjusted quarterly job vacancy data are available online (tables 14-10-0398-01, 14-10-0399-01 and 14-10-0400-01). The analyses of the job vacancy levels and rates by sector (20 broad industrial sector groups), one-digit NOC (10 broad occupational categories), province and economic region are based on seasonally adjusted data. However, the analyses of the job vacancy levels and rates by subsector, two-digit NOC, three-digit NOC, four-digit NOC, and five-digit NOC are based on non-seasonally adjusted data.
The unemployment-to-job vacancy ratio excludes the territories for consistency with the geographic coverage of the Labour Force Survey.
This analysis focuses on differences between estimates that are statistically significant at the 68% confidence level.
Data tables
Tables 14-10-0325, 14-10-0326, 14-10-0328 and 14-10-0356 have now been archived. They have been replaced with 14-10-0441-01, 14-10-0442-01, 14-10-0443-01, and 14-10-0444-01, respectively, presenting the new classifications.
Data tables are updated on December 16, 2024.
Reference
Data tables: Access the latest tables.
- Note: some data tables may best be viewed on desktop.
Definitions, data sources and methods: survey number 5217.
Previous release: Job vacancies, second quarter 2024.
Next release:
Data on job vacancies from the JVWS for the fourth quarter of 2024 will be released on March 18, 2025.
Preliminary monthly data on job vacancies from the JVWS for October 2024 will be released on December 19, 2024.
Contact information
For more information, or to enquire about the concepts, methods or data quality of this release, contact us (toll-free 1-800-263-1136; 514-283-8300; infostats@statcan.gc.ca) or Media Relations (statcan.mediahotline-ligneinfomedias.statcan@statcan.gc.ca).