
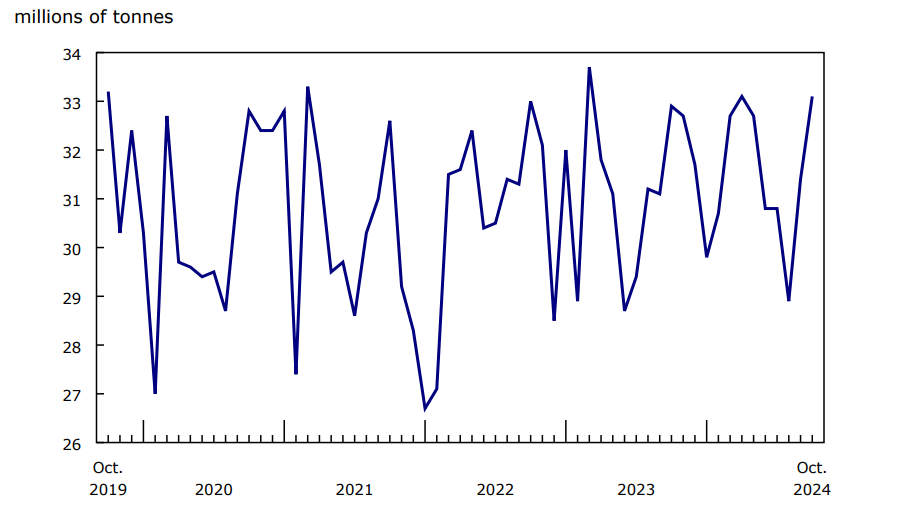
In October, the volume of cargo carried by Canadian railways reached 33.1 million tonnes, up slightly (+0.4%) from October 2023. It was the highest level for the month of October in five years.

Source(s): Table 23-10-0216-01.
Canadian grain shipments were the largest contributor to the year-over-year increase in October 2024.
To further explore the latest data and historical trends in an interactive format, please visit the "Monthly Railway Carloadings: Interactive Dashboard."
Chart 1: Railway carloadings, total tonnage
Description - Chart 1
Data table: Railway carloadings, total tonnage
Source: Table 23-10-0216-01.
The increase in total freight carried in October was caused by a higher volume of domestic loadings, both non-intermodal loadings (mainly commodities) and intermodal loadings (mainly containers).
Carloadings of some agricultural and food products increase
In October, domestic non-intermodal freight traffic was up 2.2% year over year to 26.7 million tonnes, led by large increases in the loadings of some agricultural and food products—most notably grains.
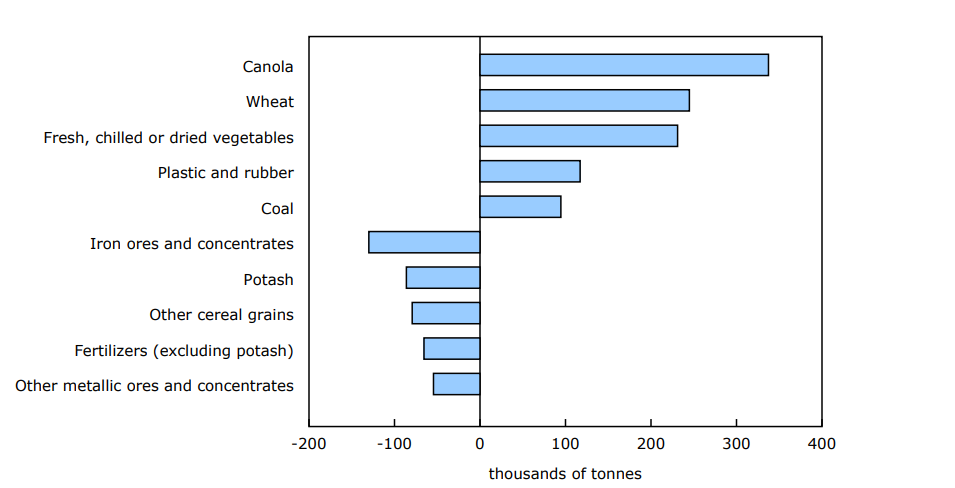
The increase in grain traffic in October, compared with the same month in 2023, reflects the lower production of field crops during the 2023 crop year. Loadings of canola have risen each month since April 2024 and grew 33.7% (+337 000 tonnes) in October from the same month a year earlier. Meanwhile, loadings of wheat increased by 10.1% (+245 000 tonnes) from October 2023 levels.
Other notable increases were reported for fresh, chilled or dried vegetables, with loadings rising by 78.9% (+231 000 tonnes) in October 2024 compared with October 2023. This was the second-largest increase in tonnage since January 2023.
Chart 2: Railway carloadings, largest commodity differences, October 2023 to October 2024
Description - Chart 2
Data table: Railway carloadings, largest commodity differences, October 2023 to October 2024
Source: Table 23-10-0216-02.
Carloadings of iron ores and concentrates fall
In October 2024, growth in non-intermodal freight loadings was moderated by decreases in several commodities. Most notable was the drop in iron ores and concentrates, which fell 2.7% (-130 000 tonnes) from the same month a year ago.
Intermodal traffic rebounds
In October, intermodal shipments (mainly containers) originating in Canada also contributed to the overall growth, increasing 3.2% year over year to 3.1 million tonnes.
The October increase may reflect higher demand as Canada's trade in consumer goods was up year over year for both exports and imports.
American freight traffic down
In October, freight loadings from the US rail connections totalled 3.3 million tonnes, a decline of 14.2%, or 538 000 tonnes, from the same month a year earlier. This was the lowest level recorded for the month of October in four years.
Note to readers
The Monthly Railway Carloadings Survey collects data on the number of rail cars, tonnage, units and 20-feet equivalent units from railway transporters operating in Canada that provide for-hire freight services.
Cargo loadings from Armstrong, Ontario, to the Atlantic Coast are classified to the eastern division (Eastern Canada), while loadings from Thunder Bay, Ontario, to the Pacific Coast are classified to the western division (Western Canada).
Survey data are revised on a monthly basis to reflect new information.
The data in this release are not seasonally adjusted.
The Transportation Data and Information Hub provides Canadians with online access to comprehensive statistics and measures on the country's transportation sector.
Reference
Data table: 23-10-0216-01.
- Note: some data tables may best be viewed on desktop.
Definitions, data sources and methods: survey number 2732.
Previous release: Railway carloadings, September 2024.
Contact information
For more information, or to enquire about the concepts, methods or data quality of this release, contact us (toll-free 1-800-263-1136; 514-283-8300; infostats@statcan.gc.ca) or Media Relations (statcan.mediahotline-ligneinfomedias.statcan@statcan.gc.ca).