

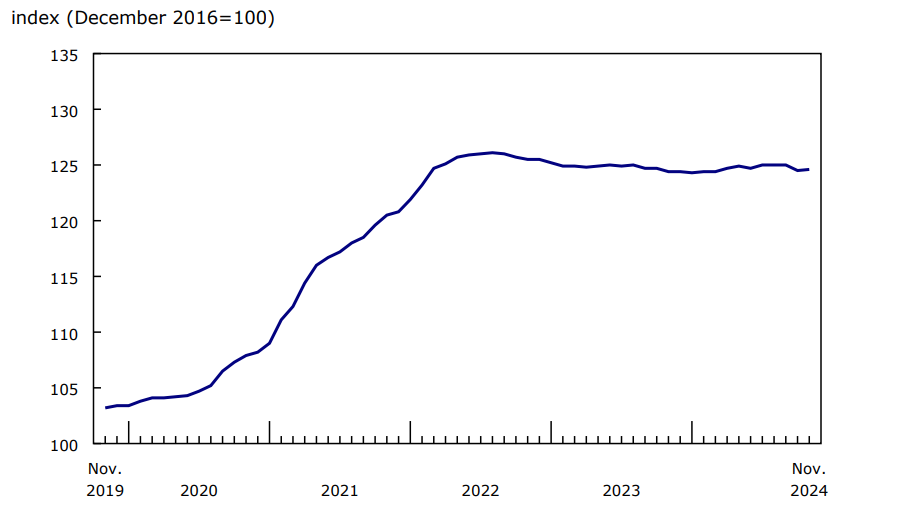
Chart 1: New Housing Price Index
Description - Chart 1
Data table: New Housing Price Index
Source: Table 18-10-0205-01.
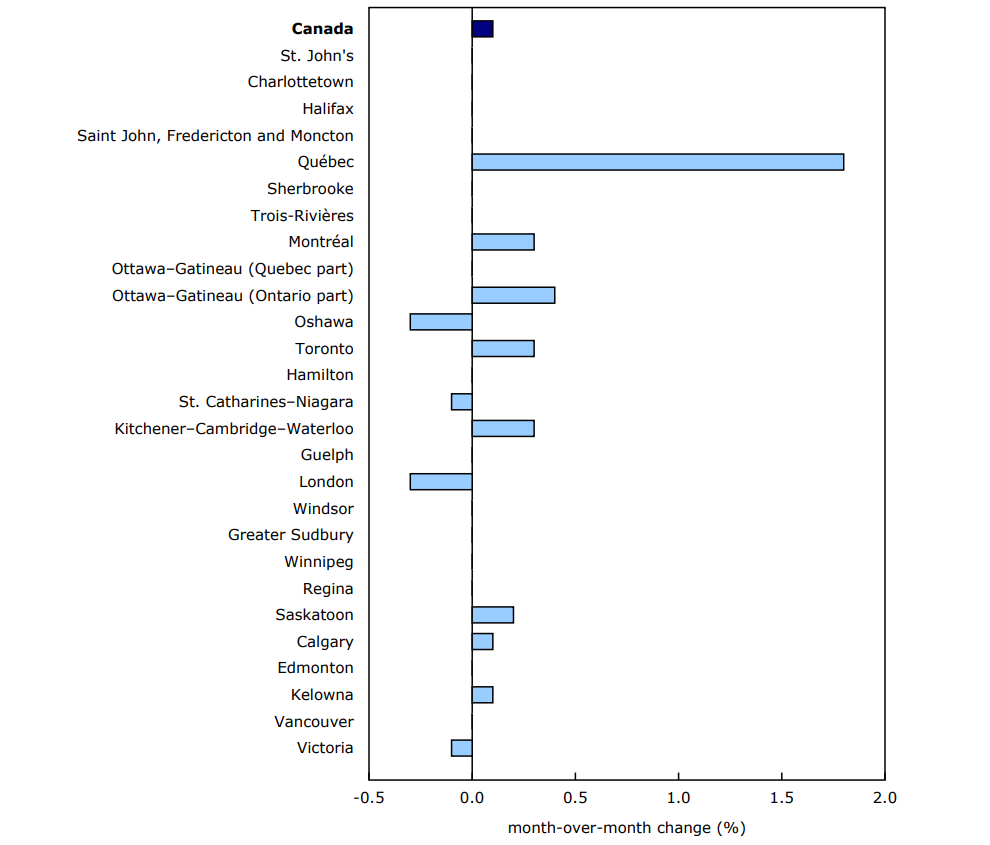
Québec leads monthly increases in November
The largest monthly new home price gains in November were recorded in Québec (+1.8%) and Ottawa (+0.4%). According to the Quebec Professional Association of Real Estate Brokers (QPAREB), the broader resale market in Québec showed more single-family home sales and fewer homes being listed on the market, thus putting upward pressure on the overall house prices. November year-to-date sales were up 16%, while active listings were down 13%, as reported by the QPAREB. The Canada Mortgage and Housing Corporation also reported there being fewer unsold single-family completed units available in the market in October (-19.9% year over year). Single-family units are single-detached, semi-detached and row houses.
The largest monthly declines in November were recorded in Oshawa (-0.3%) and London (-0.3%), where builders link the decline to weaker market conditions.
Chart 2: New house prices rise at the national level
Description - Chart 2
Data table: New house prices rise at the national level
Source: Table 18-10-0205-02.
New Housing Price Index, 12-month change
Nationally, the New Housing Price Index increased 0.2% year over year in November compared with a 0.9% annual decline in November 2023. The Bank of Canada policy rate, which impacts mortgage interest rates, was 3.75% in November 2024, compared with 5.00% at the same time one year earlier. Reduced borrowing costs made it easier to qualify for a home purchase, which in turn can put upward pressure on new home prices.
The largest annual increases in November were registered in Calgary (+4.8%), Québec (+3.8%) and Edmonton (+2.9%). The largest declines were recorded in Kitchener–Waterloo (-1.8%), Ottawa (-1.7%) and London (-1.3%).
Note to readers
The New Housing Price Index (NHPI) measures changes over time in the selling prices of new residential houses. The prices are those agreed upon between the contractor and the buyer at the time the contract is signed. The detailed specifications for each new house remain the same between two consecutive periods.
The prices collected from builders and included in the index are market selling prices less value-added taxes, such as the federal goods and services tax and the provincial harmonized sales tax.
The survey covers the following dwelling types: new single homes, semi-detached homes and townhouses (row or garden homes). The index is available at the national and provincial levels and for 27 census metropolitan areas (CMAs).
The index is not subject to revision and is not seasonally adjusted.
Reference
Data table: table 18-10-0205-01.
- Note: some data tables may best be viewed on desktop.
Definitions, data sources and methods: survey number 2310.
Previous release: New Housing Price Index, October 2024.
Next release: January 24, 2025.
Contact information
For more information, or to enquire about the concepts, methods or data quality of this release, contact us (toll-free 1-800-263-1136; 514-283-8300; infostats@statcan.gc.ca) or Media Relations (statcan.mediahotline-ligneinfomedias.statcan@statcan.gc.ca).