

Household borrowing
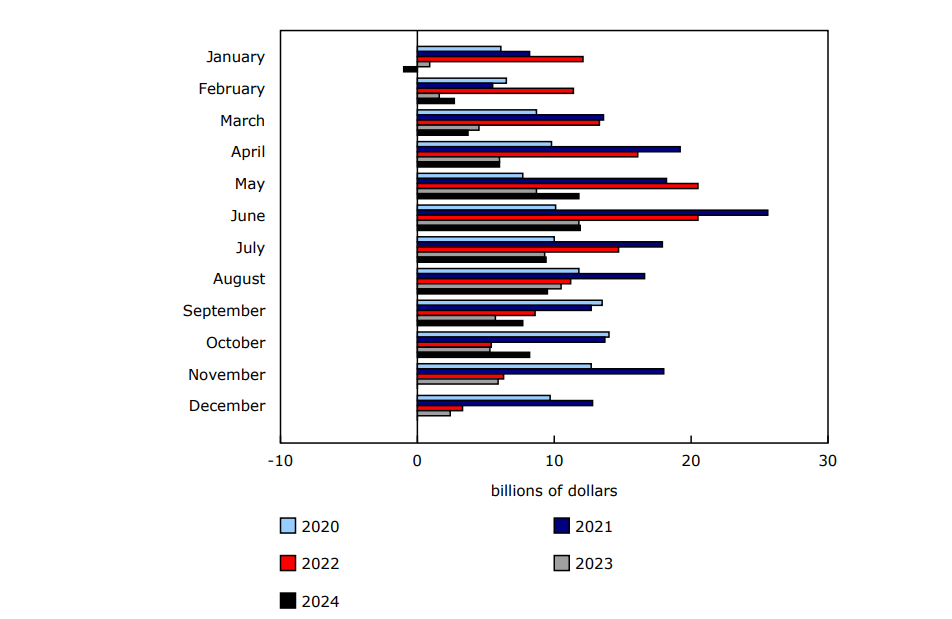
In October, the total credit liabilities of households broke the $3 trillion mark, rising 0.4% (+$13.0 billion) to reach $3,005.4 billion. Real estate secured debt, composed of both mortgage debt and home equity lines of credit, grew 0.5% (+$11.2 billion) in October. Household mortgage debt increased 0.5% (+$10.0 billion), an acceleration compared with September (+0.4%). In late October, the policy interest rate decreased 50 basis points to 3.75%, the fourth reduction in 2024. On an annualized basis, the total credit liabilities of households increased 5.3% in October, which represents an acceleration from September (+4.5%).
Chart 1: Month-over-month change in household mortgage loans
Description - Chart 1
Data table: Month-over-month change in household mortgage loans
.. not available for a specific reference period.
Note: These data are unadjusted for seasonality.
Source: Table 36-10-0639-01.
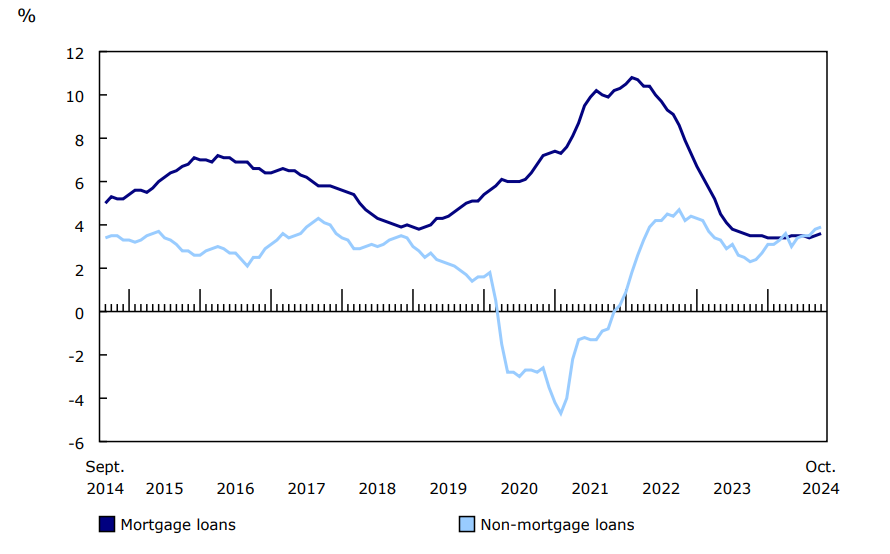
Chart 2: Year-over-year growth in household mortgage and non-mortgage loans
Description - Chart 2
Data table: Year-over-year growth in household mortgage and non-mortgage loans
Note: These data are unadjusted for seasonality.
Source: Table 36-10-0639-01.
Non-mortgage loan debt increased 0.4% (+$3.0 billion) in October. Outstanding balances on home equity lines of credit increased 0.7% (+$1.2 billion), accelerating from September (+0.5%), while credit card debt with chartered banks edged up 0.2% (+$0.2 billion) in October, slowing down from the previous month (+0.7%). In October, the remaining non-mortgage loan debt categories increased 0.3% (+$1.5 billion).
Private non-financial corporation borrowing
Total credit liabilities of private non-financial corporations increased 1.4% (+$29.8 billion) to reach $2,207.7 billion in October, a faster rise than in September (+0.4%). Non-mortgage loans with chartered banks increased 0.8% (+$5.5 billion) in October, an acceleration from September (+0.3%; +$2.3 billion). At the same time, non-mortgage loans from government lenders edged down 0.1%, while debt securities rose 2.6% (+$20.8 billion).
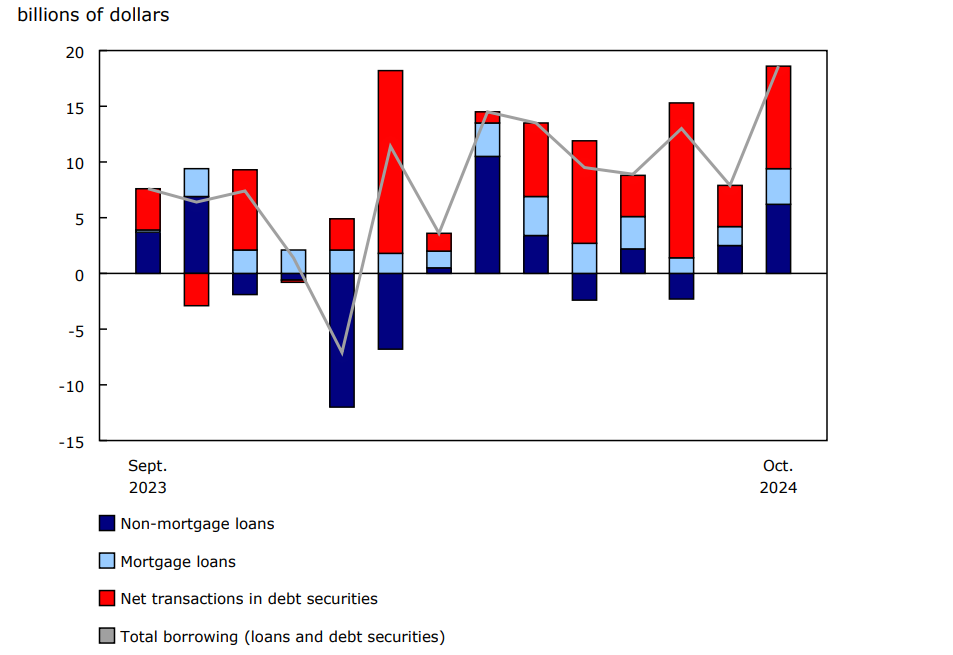
Chart 3: Private non-financial corporation borrowing
Description - Chart 3
Data table: Private non-financial corporation borrowing
Note: Borrowing is defined as the month-to-month difference in the stock of outstanding loan liabilities plus the net transactions in debt securities. These data are unadjusted for seasonality.
Sources: Tables 36-10-0640-01 and 36-10-0670-01.
Overall borrowing by private non-financial corporations, composed of the change in the level of seasonally unadjusted outstanding loans and the net transactions in debt securities, was $18.6 billion in October. The cumulative amount borrowed over the 10-month period from January to October ($93.6 billion) was higher than the same period in 2023 ($90.4 billion).
Note to readers
Unless otherwise stated, this release presents data adjusted for seasonality.
Annualized percentage changes shown in this release are calculated by taking the seasonally adjusted value for a given debt item and applying the following formula: (((debtm/debtm-1)12-1)*100), where "m" is the reference month.
Revisions
This release of the monthly credit aggregates for the month of October 2024 includes revised estimates from January 2020 to September 2024. These data incorporate new and revised data, as well as updated data on seasonal trends.
Additionally, this release incorporates revised quarterly benchmarks from the national balance sheet, from the first quarter of 2020 to the third quarter of 2024. Conceptual, methodological and statistical enhancements were incorporated into the balance sheet and are summarized in the article "An overview of the revisions to the Financial and Wealth Accounts, 2020 to 2024."
Overview of the monthly credit aggregates
The monthly credit aggregates break down a portion of the quarterly National Balance Sheet Accounts (NBSA) by month. They provide details on lending to households and non-financial corporations—in other words, the stock of these sectors' outstanding liabilities from the debtor perspective—across a range of credit instruments, including mortgage loans, non-mortgage loans, and debt and equity securities. The aggregates cover all lending sectors, including chartered banks, non-bank deposit-taking institutions, other financial corporations, governments and other lenders. The estimates are presented as booked-in-Canada to capture activity within Canada, with either domestic or non-resident lenders. In addition, amounts are reported on an end-of-period basis (i.e., the value of the stock of an asset on the final day of the month). The third month of each quarter is benchmarked to the corresponding quarterly release of the NBSA.
Household sector borrowing is divided into financing in the form of non-mortgage loans (i.e., funds principally for consumption) and mortgage loans (i.e., debt acquired to finance the purchase of a property, whether residential or non-residential in nature). Household borrowing in the form of mortgage debt and home equity lines of credit is referred to as real estate secured debt and presents a further delineation of household liabilities associated with residential and non-residential properties.
As with the household sector, non-financial corporation borrowing is divided into non-mortgage and mortgage loans. However, overall credit liabilities of non-financial corporations also include their borrowing in the form of debt securities, with terms to maturity that are both short and long term in duration.
The NBSA are composed of the balance sheets of all sectors and subsectors of the economy. The main sectors are households, non-profit institutions serving households, financial corporations, non-financial corporations, governments and non-residents. The NBSA cover all national non-financial assets and all financial asset-liability claims outstanding in all sectors and, similarly, present stocks at the end of each quarter.
Estimates are available on a seasonally adjusted basis to improve the interpretability of period-to-period changes in debt. For information on seasonal adjustment, see the article "Seasonally adjusted data – Frequently asked questions."
For more information on the concepts, methodologies and classifications used to compile these monthly estimates, see the document "Guide to the Monthly Credit Aggregates."
Reference
Data tables: Access the latest tables.
- Note: some data tables may best be viewed on desktop.
Definitions, data sources and methods: survey numbers 1804, 1806 and 5334.
Previous release: Monthly credit aggregates, September 2024.
Next release: January 17, 2025.
Contact information
For more information, or to enquire about the concepts, methods or data quality of this release, contact us (toll-free 1-800-263-1136; 514-283-8300; infostats@statcan.gc.ca) or Media Relations (statcan.mediahotline-ligneinfomedias.statcan@statcan.gc.ca).