
Today, the introduction of a new data table for Canada's international merchandise trade by mode of transport offers further insight into how goods move across Canada's borders. Data by mode of transport can reveal the impact of disruptions in transportation, such as supply chain issues, labour disruptions and natural disasters. These data can be used to better inform strategic decision-making to improve not only the efficiency of supply chains and transportation systems, but also policy related to the transportation of goods.
Table 12-10-0177-01 provides a breakdown of imports and exports by road, water, air and rail, with all other modes (such as pipeline and mail) categorized in the "other" grouping. The table provides the value of trade by sections and groups of the trade variant of the North American Product Classification System (NAPCS) 2022, as well as by Canada's principal trading partners. This new resource enables users to analyze detailed historical trends in Canada's international merchandise trade logistics, dating back to 1997.
Canada's imports are heavily reliant on road transportation, particularly for imports from the United States, because of the countries' shared border. Imports by road accounted for just over one-half (52.2%) of Canada's total import value in 2023, mostly from the United States. Road imports also grew rapidly following the economic downturn in 2009, almost doubling by 2019. In 2023, the value of road imports had risen by 41.4% from 2020, the first year of the COVID-19 pandemic. This overall growth was largely due to increases in imports in the motor vehicles and parts; industrial machinery, equipment and parts; and consumer goods sections. Imports by water also rose significantly from 2020 to 2023, on higher shipments from China, the United States, Japan and Germany.
Chart 1: Import values by mode of transport, 1997 to 2023
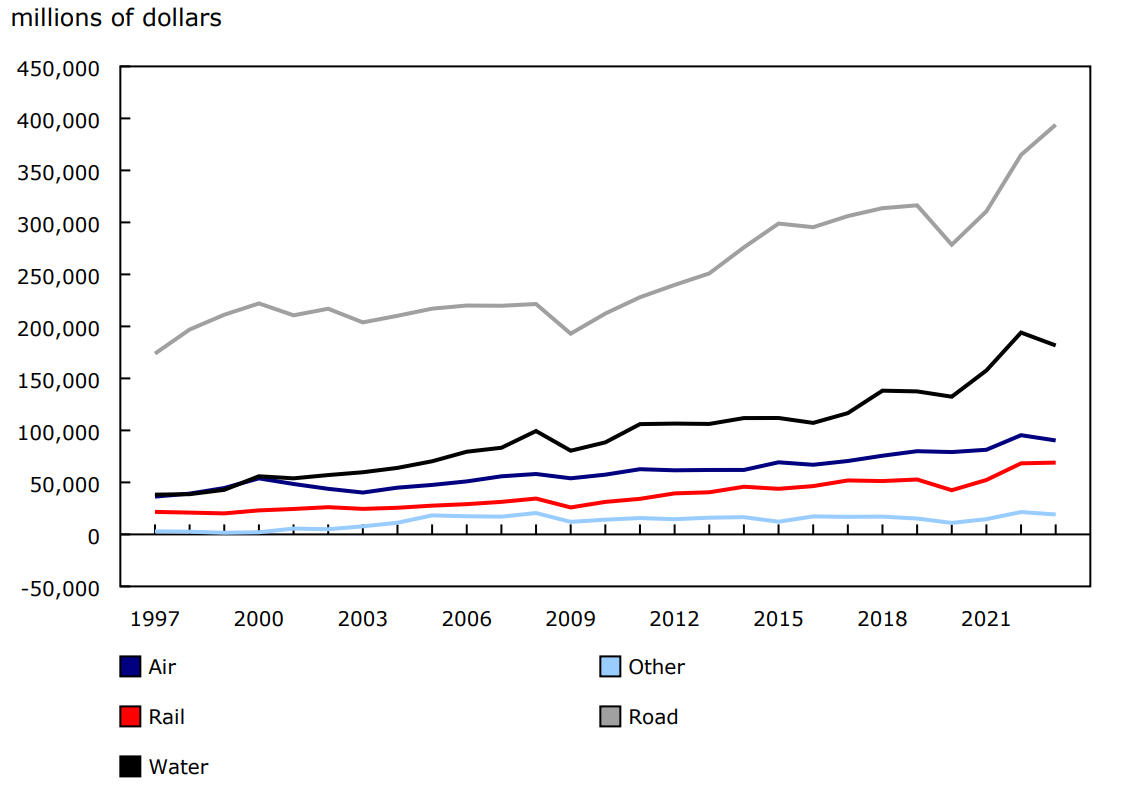
Description - Chart 1
Data table: Import values by mode of transport, 1997 to 2023
Note: Data are on a customs basis and not seasonally adjusted.
Source: Table 12-10-0177-01.
Similar to imports, exports by road also grew following the economic downturn, more than doubling from 2009 to 2019. There was a further surge in exports by road following the pandemic, with values rising by 43.0% from 2020 to 2023. In 2023, shipments by road accounted for 39.7% of total exports. Export values by "other" modes of transport also grew significantly following the pandemic, more than doubling from 2020 to 2022. Energy products accounted for most of the exports by the "other" category, owing to the extensive use of pipelines to transport oil and gas to the United States. Trends within this category often coincide with shifts in energy prices, as was the case in 2023 when export values by "other" modes of transportation to all countries fell 17.9% from the previous year, as energy exports fell mainly on lower prices. Despite the decline, exports by other modes of transportation still accounted for nearly one-fifth (19.2%) of total exports in 2023.
Chart 2: Export values by mode of transport, 1997 to 2023
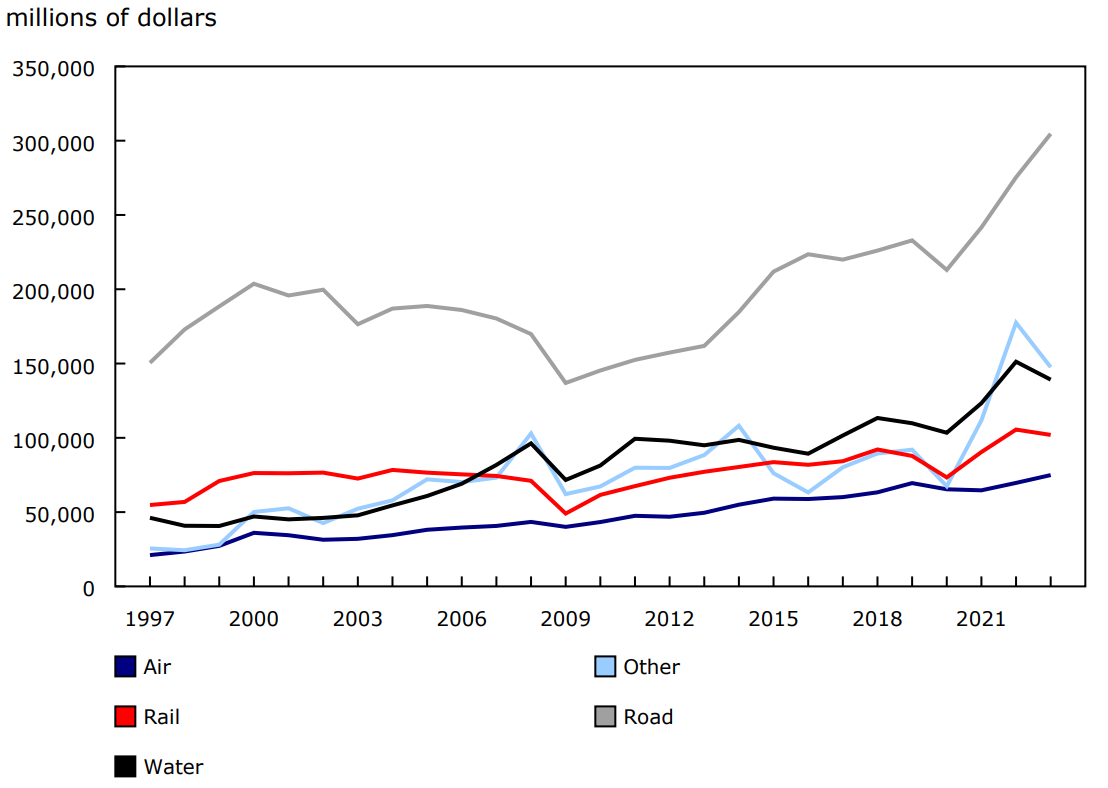
Description - Chart 2
Data table: Export values by mode of transport, 1997 to 2023
Note: Data are on a customs basis and not seasonally adjusted.
Source: Table 12-10-0177-01.
Note to readers
The data presented in this release are on a customs basis, not seasonally adjusted. When analyzing unadjusted trade data, month to month fluctuations may be the result of seasonal patterns rather than significant changes in underlying trends in trade.
Customs-based trade in goods data aim to capture the movement of merchandise across the Canadian border, both outgoing (exports) and incoming (imports). In other words, this approach measures the two-way physical flow of commodities crossing economic territories.
International trade data by country are available for Canada's 27 principal trading partners (PTPs). The list of PTPs is based on their annual share of total merchandise trade—imports and exports—with Canada in 2012.
For imports, the mode of transport reflects the mode of transport by which the goods arrived in Canada. Although goods may travel via multiple transportation methods, only the mode used to cross into Canada is recorded. For exports, the mode of transport reflects the mode of transport by which the goods leave Canada.
Import values for the PTPs are presented based on the country of export, that is the country from which the goods were shipped directly to Canada. The concept of the country of export differs from that of the country of origin, which is defined as the country in which the goods were grown, extracted, or manufactured. Import values by country of export and country of origin may vary; more information on these concepts and on the resulting trade values can be found in the article "Balance of Payments trade in goods at Statistics Canada: Expanding geographic detail to 27 principal trading partners."
Export values for the PTPs are presented based on the last known destination of the goods at the time of export from Canada.
Important notice to users of import statistics following the implementation of CBSA Assessment and Revenue Management (CARM)
Statistics Canada's primary data source used in the compilation of import statistics is undergoing a major transition as a result of the Canada Border Services Agency (CBSA) Assessment and Revenue Management (CARM) digital initiative, implemented on October 21, 2024. Despite improved coverage since the last publication of Canadian International Merchandise Trade statistics, delays in the receipt of import data at Statistics Canada continue to impact the completeness and quality of import statistics.
Analysis indicates that additional data volumes will be received for the reference months of November and also October after Statistics Canada's deadline for monthly collection. While strategies for producing estimates to account for the late receipt of data have been enhanced to maximize the comprehensiveness of merchandise trade indicators for these months, Statistics Canada's ability to respond to these issues is limited.
Canadian International Merchandise Trade statistics are produced on both a customs basis and a balance of payments basis. Customs basis statistics are highly detailed and multi-dimensional, while more aggregated balance of payments basis statistics are aligned with Canada's macroeconomic accounting framework and are the source for key indicators related to merchandise trade. Within the customs basis statistics, the use of estimates is limited compared with the balance of payments basis statistics, relying on placeholder estimates within the special transactions category to partially account for data expected to be received at a later date. Within balance of payments basis statistics, estimation is more comprehensive in order to produce a more complete picture of Canada's import activity throughout the various categories for the affected months.
In light of the issues that are temporarily impacting the completeness and quality of international merchandise trade statistics, users should exercise caution and expect material revisions until the situation stabilizes, notably for import statistics on a customs basis. Statistics Canada will provide further updates as new information becomes available.
Reference
Data table / Data tables: 12-10-0177-01.
- Note: some data tables may best be viewed on desktop.
Definitions, data sources and methods: survey number 2201.
Contact information
For more information, or to enquire about the concepts, methods or data quality of this release, contact us (toll-free 1-800-263-1136; 514-283-8300; infostats@statcan.gc.ca) or Media Relations (statcan.mediahotline-ligneinfomedias.statcan@statcan.gc.ca).