
Highlights
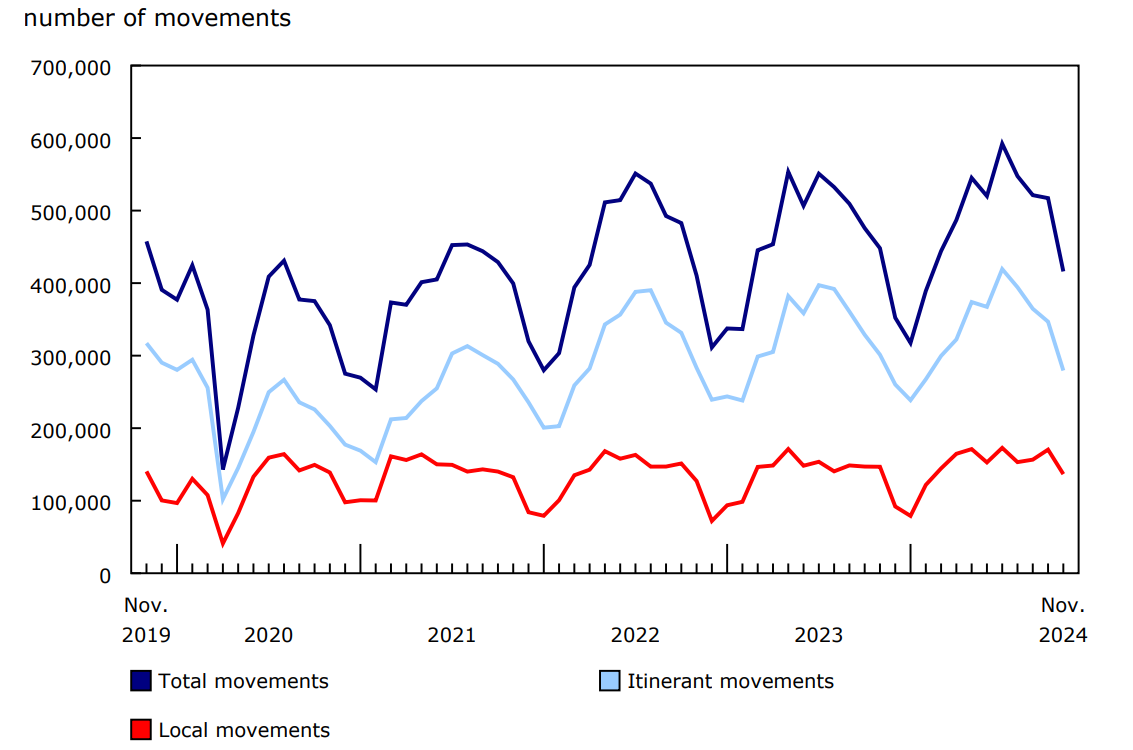
In November, Canada's major and select small airports recorded a total of 416,127 aircraft movements, down 7.1% from November 2023. Itinerant movements decreased 7.2% year over year in November 2024, while local movements fell 6.9%.
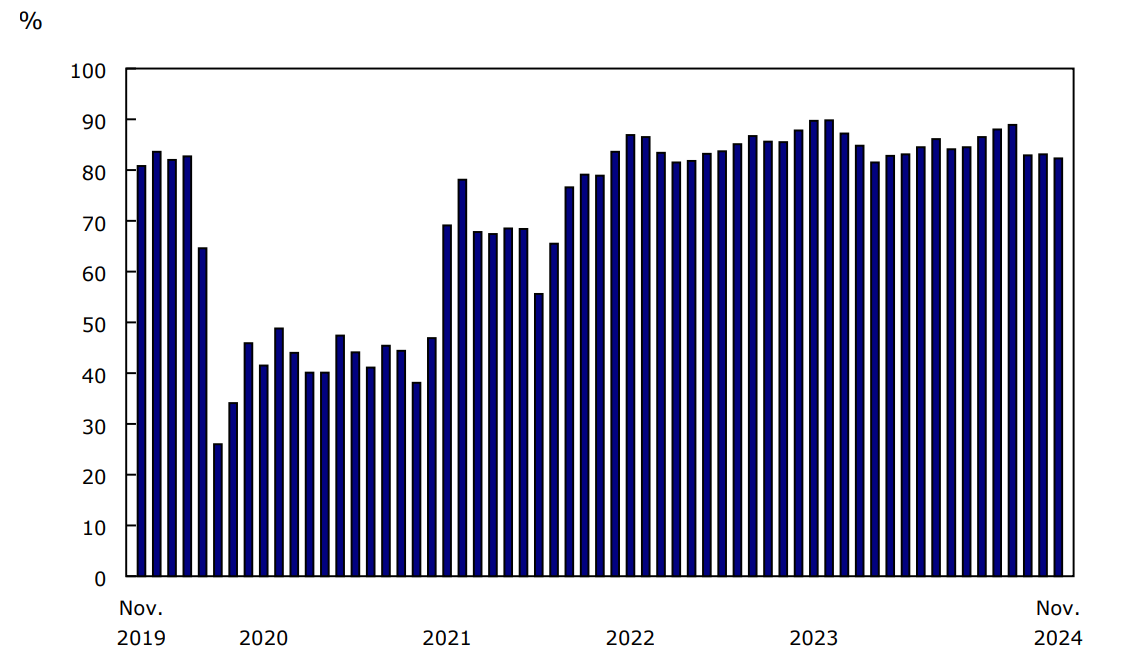
At the same time, major Canadian airlines flew 6.5 million passengers on scheduled and charter services in November, with a passenger load factor of 82.3%.
Consult the Aviation Data Visualization Hub to explore aircraft movement statistics and monthly civil aviation statistics in an interactive format.
Domestic movements decline in November
In November, domestic movements recorded a year-over-year decline of 8.8% to 230,624, driven by a 20.7% decrease among smaller carriers (Level IV to VI). Other international traffic (outside the United States) rose 4.7% to 15,677, while transborder movements (to and from the United States) declined 0.6% to 33,176.
Chart 1: Total aircraft movements at major and select small airports, by class of operation
Description - Chart 1
Data table: Total aircraft movements at major and select small airports, by class of operation
Source: Table 23-10-0296-01.
Widespread declines in traffic
In November, year-over-year decreases in aircraft movements were noted in 10 provinces and territories. The largest declines were reported at Moncton/Greater Moncton International (-46.4%) and Fredericton International (-39.6%) airports because of reduced flight school activity. Movements at Toronto/Lester B. Pearson International, Canada's busiest airport, edged up 0.7% on slight increases in transborder and other international traffic.
Major airlines' operating and financial statistics
The seven Canadian Level I air carriers flew 6.5 million passengers on scheduled and charter services in November, 8.7% more than in November 2023, when there were six Level I carriers. One Level II air carrier was reclassified to Level I in 2024.
The number of passenger-kilometres in November was 16.8 billion, with a capacity of 20.5 billion available seat-kilometres. As a result, the passenger load factor (the ratio of passenger-kilometres to available seat-kilometres) was 82.3%. This was the first month in 2024 when the load factor was higher than in the same month of 2023 (81.5% in November 2023).
Chart 2: Passenger load factor, Canadian air carriers, Level I
Description - Chart 2
Data table: Passenger load factor, Canadian air carriers, Level I
Source: Table 23-10-0079-01.
Each passenger travelled an average of 2,594 kilometres in November 2024, up slightly (+0.7%) from the same month one year earlier.
Level I carriers flew 167,000 hours in November and generated $2.2 billion in total operating revenue.
Note to readers
As of reference month January 2024, Statistics Canada publishes a new consolidated monthly release called "Aircraft movement and civil aviation statistics." The new release covers the following survey programs:
- Aircraft movement statistics (survey number 2715, tables 23-10-0296-01 to 23-10-0304-01)
- Monthly civil aviation statistics (survey number 5026, table 23-10-0079-01).
The tables associated with the above survey programs remain unchanged and will be updated as usual. Definitions, data sources and methods for each survey program remain accessible through each survey's respective number.
Consult the Aviation Data Visualization Hub to explore data from Aircraft movement statistics and Monthly civil aviation statistics in an interactive format.
The aviation statistics program uses respondent (Monthly civil aviation statistics) and administrative (Aircraft movement statistics) data.
An aircraft movement is defined as a take-off, landing or simulated approach by an aircraft, as defined by NAV CANADA.
An itinerant movement is the initial take-off or the final landing of an aircraft.
A local movement is an aircraft conducting the following airport activities: touch-and-go, stop-and-go, simulated approach without landing, low approach, pull up while on final approach or missed approach. Local movements are often carried out during training flights (touch-and-go), equipment tests, etc.
On July 11, 2024, the flight service station at Peace River, British Columbia, was officially closed. Starting in August 2024, movements for Peace River Airport are excluded from the Aircraft movement and civil aviation statistics. Data prior to August 2024 will continue to be available.
The Monthly Civil Aviation Survey covers all Canadian Level I air carriers: Air Canada (including Air Canada Rouge), Air Transat, Flair, Jazz, Porter, Sunwing and WestJet (including WestJet Encore and WestJet Link). The number of air carriers increased from six in 2023 to seven in 2024 because one Level II air carrier was reclassified to Level I.
The average passenger trip length is calculated by dividing the number of passenger-kilometres by the number of passengers. Trips across Canada and around the world are included in this calculation.
The data in this monthly release are not seasonally adjusted.
Data are subject to revisions.
Reference
Data tables: : 23-10-0079-01 and 23-10-0296-01 to 23-10-0304-01.
- Note: some data tables may best be viewed on desktop.
Definitions, data sources and methods: survey numbers 2715 and 5026.
Previous release: Aircraft movement and civil aviation statistics, October 2024.
Contact information
For more information, or to enquire about the concepts, methods or data quality of this release, contact us (toll-free 1-800-263-1136; 514-283-8300; infostats@statcan.gc.ca) or Media Relations (statcan.mediahotline-ligneinfomedias.statcan@statcan.gc.ca).