

Research and development (R&D) personnel play an important role in fostering innovation and technological advancements. In 2022, the number of full-time equivalent (FTE) personnel engaged in R&D reached 315,030 (FTEs), reflecting an increase of 11,310 FTEs (+3.7%) from the previous year. This growth marks the sixth consecutive annual increase and aligns with the rise in Canada's gross domestic R&D expenditures, which grew by 9.0% to $51.7 billion in 2022.
The number of R&D personnel rose across all provinces and territories in 2022, with Quebec (+4,240 FTEs to 88,090 FTEs; +5.1%) and Ontario (+3,110 FTEs to 140,890 FTEs; +2.3%) accounting for almost two-thirds of the total gain. British Columbia also saw a strong increase (+1,550 FTEs to 40,710 FTEs; +4.0%).
Research and development personnel by performing sector and occupational category
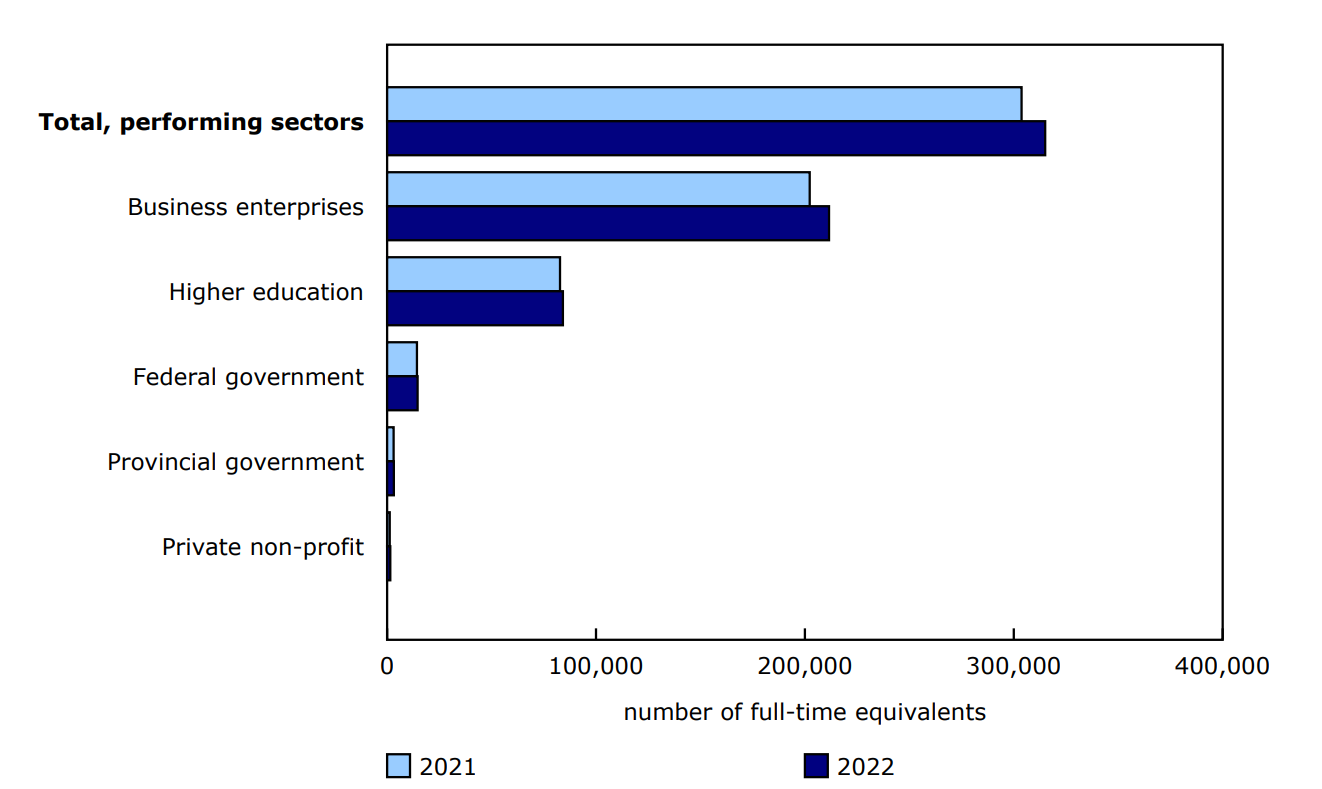
In 2022, over 90% of the increase occurred in the two largest performing sectors: business enterprises (+9,250 FTEs to 211,550 FTEs; +4.6%) and higher education (+1,380 FTEs to 84,150 FTEs; +1.7%).
Chart 1: Canada's research and development personnel by performing sector, 2021 and 2022
Description - Chart 1
Data table: Canada's research and development personnel by performing sector, 2021 and 2022
Source: Table 27-10-0023-01.
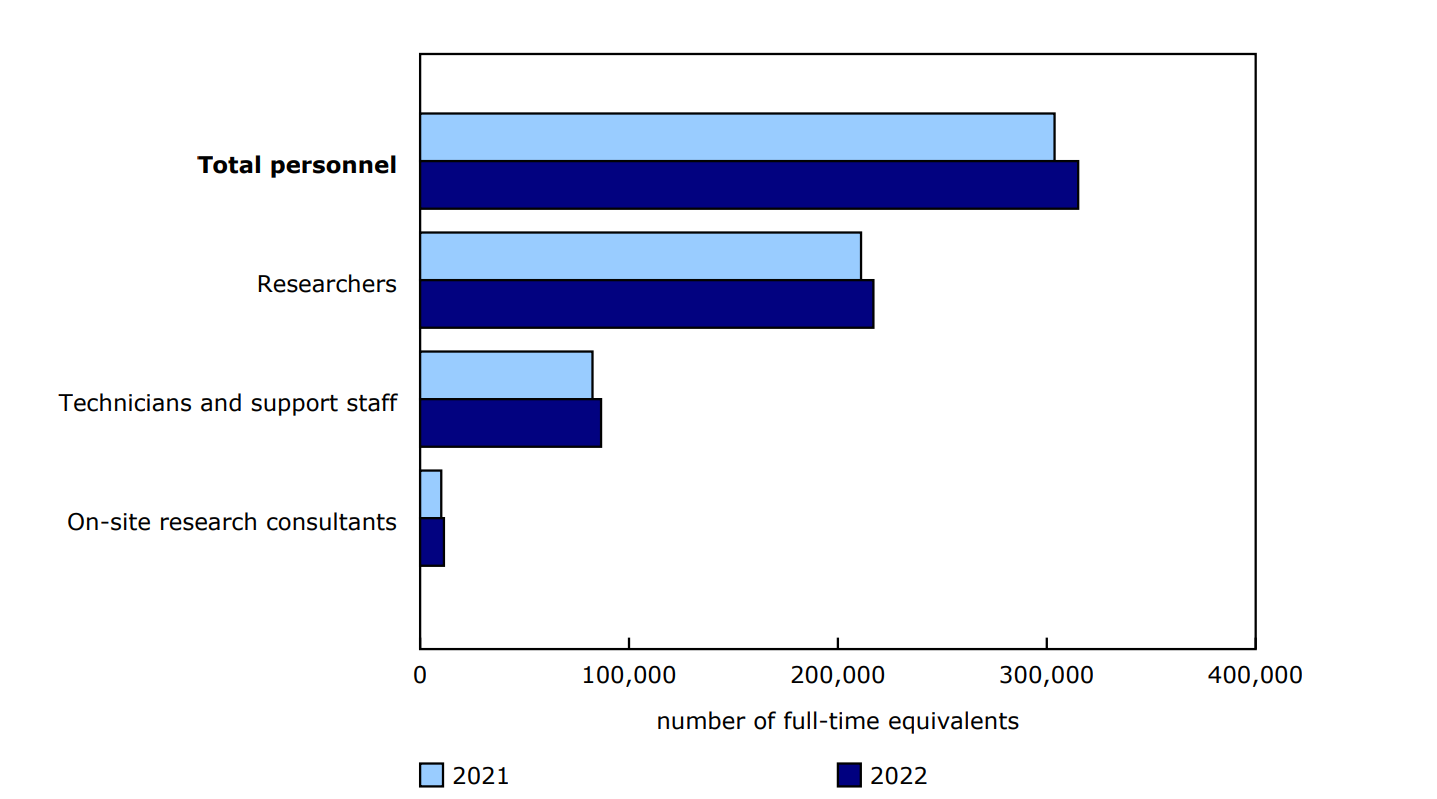
The increase in R&D personnel in 2022 occurred across all three occupational categories. Specifically, the number of researchers rose by 5,920 to 217,000 FTEs; technicians and support staff increased by 4,100 to 86,620 FTEs; and the number of on-site research consultants was up by 1,280 to 11,400 FTEs.
Within the three occupation types, researchers accounted for 68.9% of total personnel, followed by technicians and support staff (27.5%) and on-site research consultants (3.6%).
Chart 2: Canada's research and development personnel by occupational category, 2021 and 2022
Description - Chart 2
Data table: Canada's research and development personnel by occupational category, 2021 and 2022
Source: Table 27-10-0023-01.
Research and development personnel on a global scale
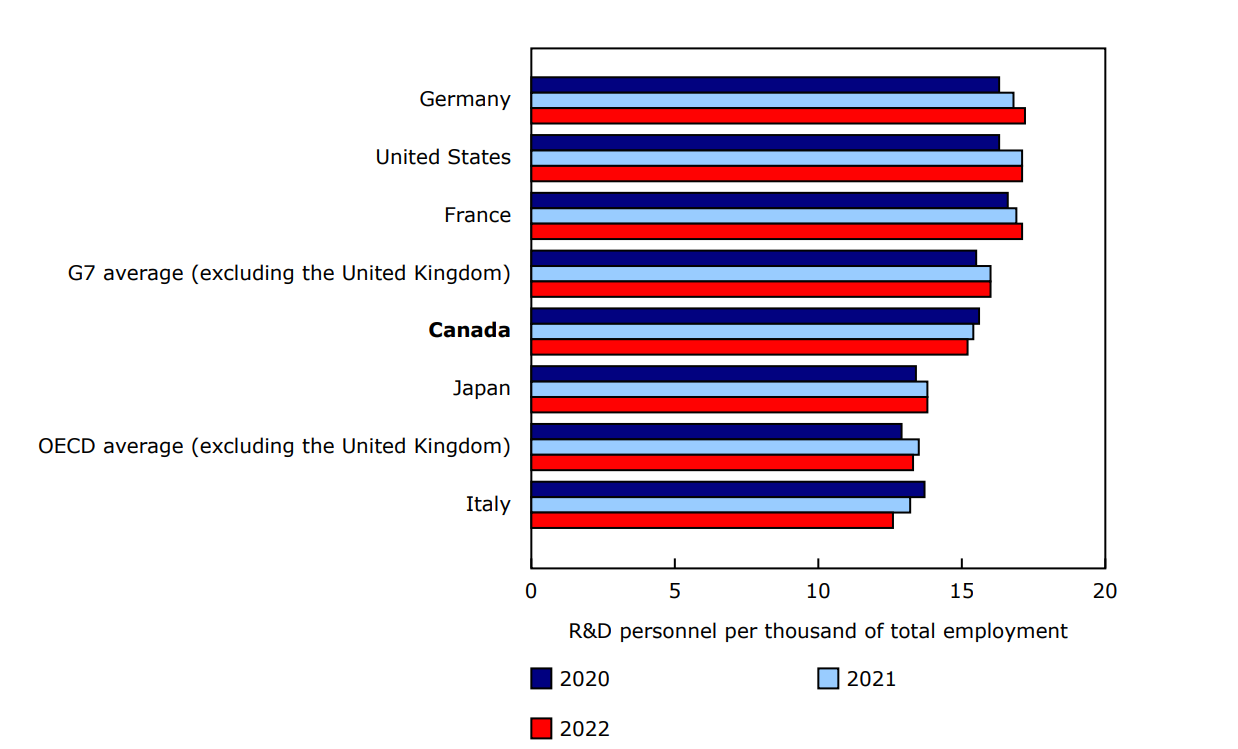
Canada's ratio of R&D personnel per thousand total employment decreased slightly from 15.4 in 2021 to 15.2 in 2022. This placed Canada below the Group of Seven (G7) average (16.0), although ranked above Japan (13.8) and the average for countries from the Organisation for Economic Co-operation and Development (OECD; 13.3). In terms of R&D spending, Canada had the second-lowest level in the G7 and was below the OECD average.
Chart 3: Research and development (R&D) personnel per thousand of total employment in Organisation for Economic Co-operation and Development (OECD) countries, 2020 to 2022
Description - Chart 3
Notes: The ratio of research and development (R&D) personnel per thousand total employees is a metric that allows for international comparisons. The United Kingdom is not included in the calculation of the average R&D ratio among Organisation for Economic Co-operation and Development (OECD) countries from 2020 to 2022 because its data were not available at the time of this publication. The United States value for 2022 is imputed using the total employment annual growth rate. The R&D personnel ratio per thousand total employees is calculated as the number of R&D personnel divided by the total labour force, then multiplied by 1,000. The international average was calculated with all available data in the Main Science and Technology Indicators (MSTI) database provided by the OECD. The MSTI database does not include on-site consultants' values in the total R&D personnel for Canada as of 2014.
Sources: Tables 27-10-0023-01 and 36-10-0489-01, and the Organisation for Economic Co-Operation and Development, Main Science and Technology Indicators (MSTI database).
Sustainable development goals
On January 1, 2016, the world officially began implementation of the 2030 Agenda for Sustainable Development—the United Nations' transformative plan of action that addresses urgent global challenges over the next 15 years. The plan is based on 17 specific sustainable development goals.
Providing data on research and development personnel is an example of how Statistics Canada supports the reporting on the global sustainable development goals. This release will be used to help measure the following goal: 9: Industries, innovation and infrastructure
Note to readers
Research and development (R&D) personnel counts are rounded to the nearest 10 and reported as full-time equivalents. Full-time equivalent is a measure of the time actually devoted to R&D. An employee who is engaged in R&D for half a year has a full-time equivalence of 0.5.
R&D personnel encompasses a variety of occupations that are classified into three categories according to their R&D function (Frascati Manual 2015): researchers, technicians and support staff.
Researchers are professionals engaged in the conception or creation of new knowledge. They conduct research and improve or develop concepts, models and methods. Managers and administrators who plan and manage the scientific and technical aspects of a researcher's work, as well as graduate students, are also included.
Technicians and equivalent staff perform scientific and technical tasks involving the application of concepts and operational methods in one or more fields of natural sciences and engineering or social sciences, humanities and the arts, normally under the supervision of researchers.
Support staff includes skilled and unskilled craftspeople, and administrative, secretarial and clerical staff directly associated with R&D projects.
On-site research consultants represent self-employed individuals or contractors who work on the site of the R&D performer and contribute to their intramural R&D. While on-site research consultants are not considered part of the performer's intramural R&D personnel, the Organisation for Economic Co-operation and Development has directed countries to include these consultants as part of total R&D personnel.
R&D personnel ratio per thousand of total employment is an indicator that allows for data comparisons between countries over time. It is calculated as the total R&D personnel (in full-time equivalents, FTEs) divided by the total employment (in persons), then multiplied by 1,000.
Beginning with 2014 data, the business enterprise R&D sector's statistical program concepts and methodology were redesigned. Users should therefore exercise caution when comparing data from 2014 onwards with historical datasets. Documentation on this methodology can be found on the Research and Development in Canadian Industry (changes to the survey for reference year 2014) page of our website.
There are five performing sectors in Canada's R&D personnel release: business enterprise, private non-profit, higher education, federal government and provincial government (which includes provincial research organizations).
References
Main Science and Technology Indicators (MSTI Database) (2025). On this page, under "Related files," download the Excel Workbook and search for "Total R&D personnel (FTE) per thousand total employment" in the "List of tables" tab.
Reference
Data tables: 27-10-0022-01 and 27-10-0023-01.
- Note: some data tables may best be viewed on desktop.
Definitions, data sources and methods: survey number 5193.
Previous release: Research and development personnel, 2021.
Contact information
For more information, or to enquire about the concepts, methods or data quality of this release, contact us (toll-free 1-800-263-1136; 514-283-8300; infostats@statcan.gc.ca) or Media Relations (statcan.mediahotline-ligneinfomedias.statcan@statcan.gc.ca).