

National overview
Residential building construction costs increased 0.8% in the fourth quarter, following a 0.9% increase in the previous quarter. Non-residential building construction costs rose 0.8% in the fourth quarter, following a 0.6% increase in the previous quarter.
The quarterly growth of residential building and non-residential building construction costs continued to slow compared with the COVID-19 pandemic period and the post-pandemic period.
Year over year, construction costs for residential buildings in the 15-census metropolitan area (CMA) composite rose 3.7% in the fourth quarter, while non-residential building construction costs increased 3.8%.
Builders noted that in the fourth quarter the industry continued to face cost pressure from skilled labour shortages and related labour rate increases, alongside building code changes and availability of land for development.
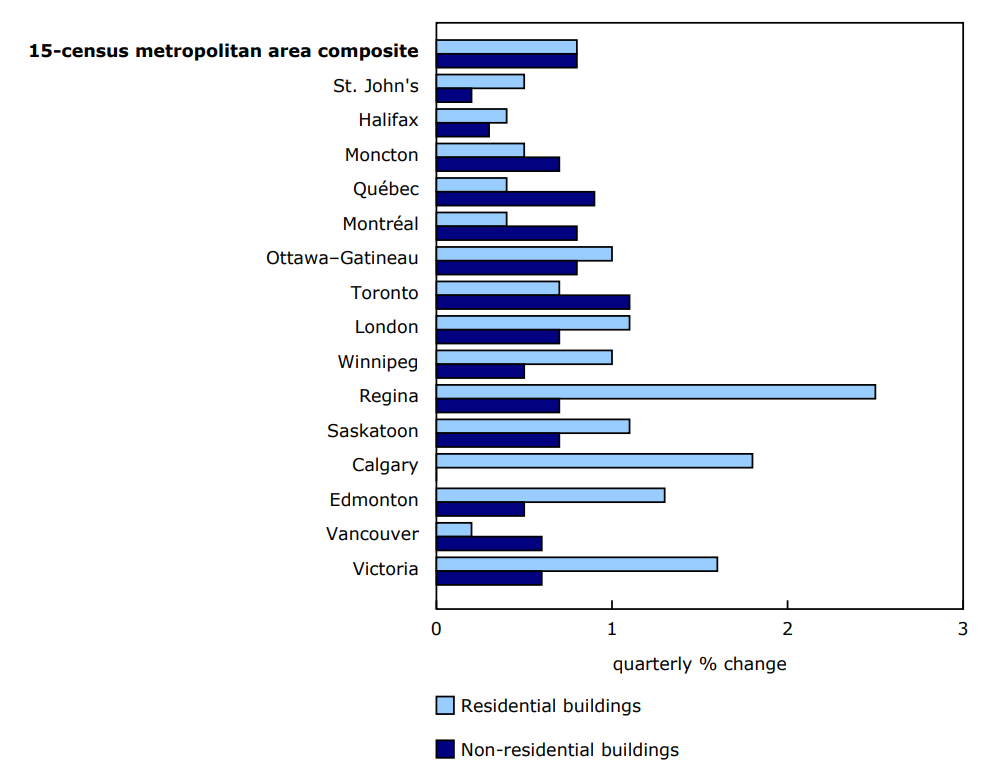
Chart 1: Building construction price indexes, quarterly change, fourth quarter of 2024
Description - Chart 1
Data table: Building construction price indexes, quarterly change, fourth quarter of 2024
Source: Table 18-10-0289-02.
General requirements division leads residential construction cost growth
In the fourth quarter, residential building construction costs rose across all 15 CMAs measured. Regina (+2.5%) saw the largest quarterly increase, followed by Calgary (+1.8%), while Vancouver (+0.2%) experienced the lowest quarterly growth in residential construction costs.
At the division-level for residential building construction, the general requirements (+1.6%) and finishes (+1.5%) divisions recorded the largest quarterly increases in the fourth quarter. The structural steel framing (-0.7%) and masonry (-0.3%) divisions experienced quarterly price declines.
Toronto leads non-residential construction cost growth
Costs to construct non-residential buildings increased the most in Toronto (+1.1%) in the fourth quarter, followed by Québec (+0.9%), Ottawa (+0.8%) and Montréal (+0.8%). Halifax (+0.2%) and St. John's (+0.2%) recorded the smallest increases, while the non-residential building construction composite price index in Calgary experienced no price movement.
Non-residential building construction costs increased across all divisions measured in the fourth quarter, with the conveying equipment (+2.4%) and electrical (+1.3%) divisions recording the largest increases.
Table 1: Building construction price indexes
Note to readers
The building construction price indexes are quarterly series that measure the change over time in the prices that contractors charge to construct a range of new commercial, institutional, industrial and residential buildings in 15 census metropolitan areas (CMAs): St. John's, Halifax, Moncton, Québec, Montréal, Ottawa–Gatineau (Ontario part), Toronto, London, Winnipeg, Regina, Saskatoon, Calgary, Edmonton, Vancouver and Victoria. Provincial-level indexes are also calculated and are based on the respective CMA-level movements.
These buildings include six non-residential structures: an office building, a warehouse, a shopping centre, a factory, a school, and a bus depot with maintenance and repair facilities. In addition, indexes are produced for four residential structures: a single-detached house, a townhouse, a high-rise apartment building (five storeys or more) and a low-rise apartment building (fewer than five storeys).
The contractor's price reflects the value of all materials, labour, equipment, overhead and profit to construct a new building. It excludes value-added taxes and any costs for land, land assembly, building design, land development and real estate fees.
With each release, data for the previous quarter may have been revised. The index is not seasonally adjusted.
With the publication of the third quarter of 2024 data, the indexes have been rebased to 2023=100 and table 18-10-0276 has been archived and replaced by table 18-10-0289. The information that was in table 18-10-0276 has been rebased and is also available in the new table, except for the four new CMAs, for which data are only available from 2023 onwards. Even though the indexes have been rebased, the quarterly changes of the indexes prior to 2023 are identical to what was released in the previous tables. Any differences that are identified are due to rounding. The quarterly changes from 2023 onwards may have changed because the weights have been updated and four CMAs were added.
CMA-level and building-level weights are available on an annual basis and can be found in table 18-10-0290. Further, division-level weights for all building types within each CMA are available on an annual basis and can be found in table 18-10-0291.
Reference
Data table : 18-10-0289-01.
- Note: some data tables may best be viewed on desktop.
Definitions, data sources and methods: survey number 2317.
Previous release: Building construction price indexes, third quarter 2024.
Contact information
For more information, or to enquire about the concepts, methods or data quality of this release, contact us (toll-free 1-800-263-1136; 514-283-8300; infostats@statcan.gc.ca) or Media Relations (statcan.mediahotline-ligneinfomedias.statcan@statcan.gc.ca).