

Highlights
Operating revenue for the 24 largest Canadian air carriers totalled $9.6 billion in the third quarter, down 0.4% compared with the same quarter of 2023.
At $8.5 billion, passenger revenue was the main revenue source for airlines in the third quarter of 2024, while air cargo generated $599.7 million in revenue.
During the busy summer travel season from July to September, Canadian carriers transported 25.0 million passengers on scheduled and charter services.
Operating revenue eases
During the third quarter, operating revenue for the 24 largest Canadian air carriers (Levels I and II) totalled $9.6 billion, down slightly (-0.4%) from the third quarter of 2023 albeit 19.1% higher than the same quarter in 2019, before the COVID-19 pandemic. This marked the first year-over-year decrease in revenue since the first quarter of 2021, when air travel began its post-pandemic recovery.
At $8.5 billion, passenger revenue represented 88.6% of total operating revenue in the third quarter of 2024, while cargo revenue, accounting for 6.2% of total operating revenue, stood at $599.7 million.
Chart 1: Quarterly goods revenue, Canadian air carriers
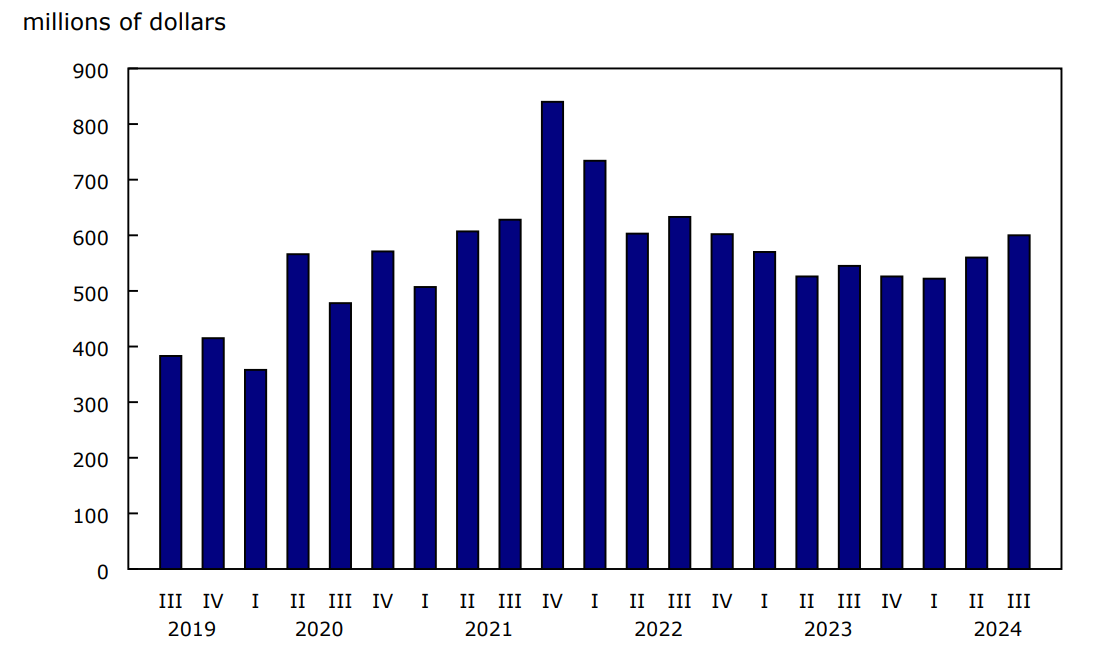
Description - Chart 1
Data table: Quarterly goods revenue, Canadian air carriers
Source: Table 23-10-0260-01.
On the other side of the ledger, total operating expenses were $8.3 billion in the third quarter, 5.5% higher than in the third quarter of 2023 and 23.0% higher than the same quarter in 2019.
Chart 2: Operating revenue and expenses, Canadian air carriers
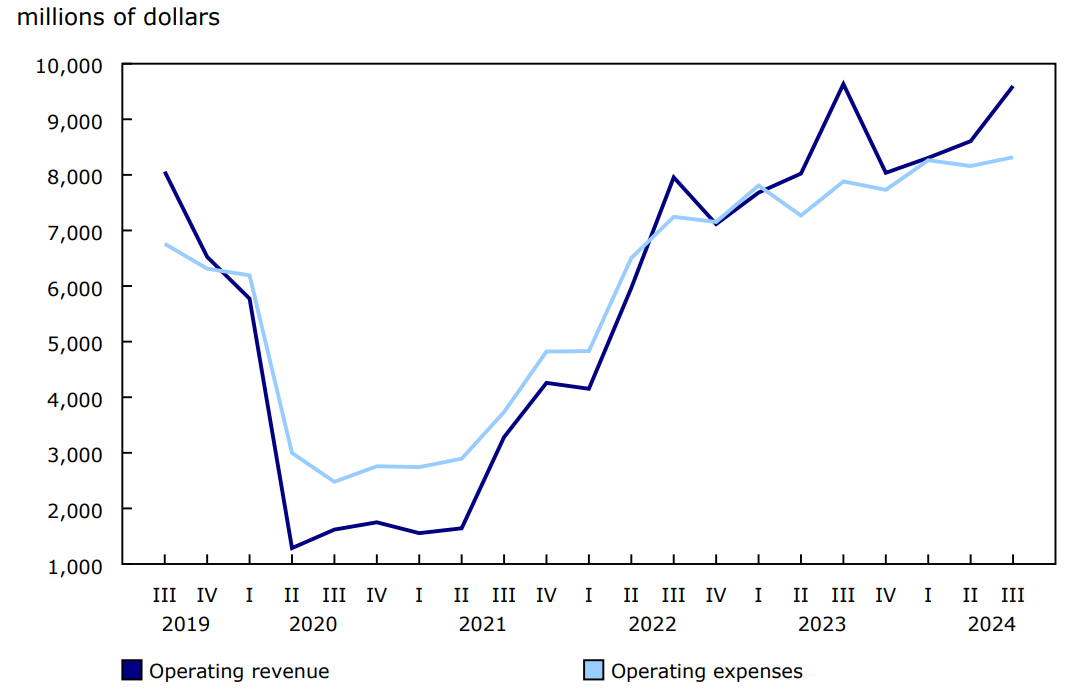
Description - Chart 2
Data table: Operating revenue and expenses, Canadian air carriers
Source: Table 23-10-0260-01.
Other operating expenses, such as depreciation and maintenance, accounted for the largest share (51.6%) of total operating expenses in the third quarter of 2024, followed by turbo fuel (26.4%) and wages, salaries and benefits (22.0%).
Passenger traffic edges up
The 24 largest Canadian air carriers transported 25.0 million passengers in the third quarter, 24.5 million on scheduled flights and 503,000 on chartered flights. While this represented an increase of 0.5% from the third quarter of 2023, it was 1.2% below the pre-pandemic level reported in the same quarter in 2019.
In the third quarter of 2024, there were 13.1 million passengers on domestic routes and 11.9 million passengers on international routes. Among the international passengers, 5.5 million had taken transborder flights (between Canada and the United States) and 6.4 million were carried on other international flights.
Chart 3: Passengers carried, by sector, Canadian air carriers
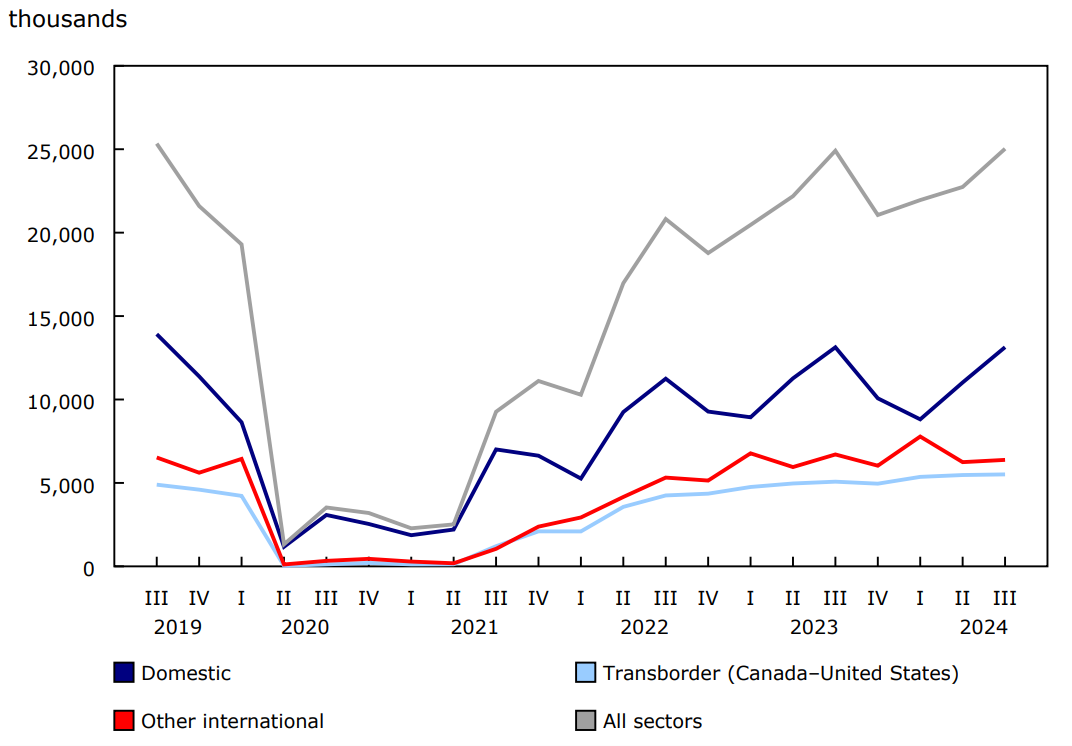
Description - Chart 3
Data table: Passengers carried, by sector, Canadian air carriers
Source: Table 23-10-0259-01.
Scheduled (non-charter) traffic was 68.0 billion passenger-kilometres in the third quarter, while capacity was 78.9 billion available seat-kilometres, resulting in a load factor of 86.1%, on par with the load factor from the same quarter in 2019 (85.7%).
Chart 4: Passenger load factor, Canadian air carriers
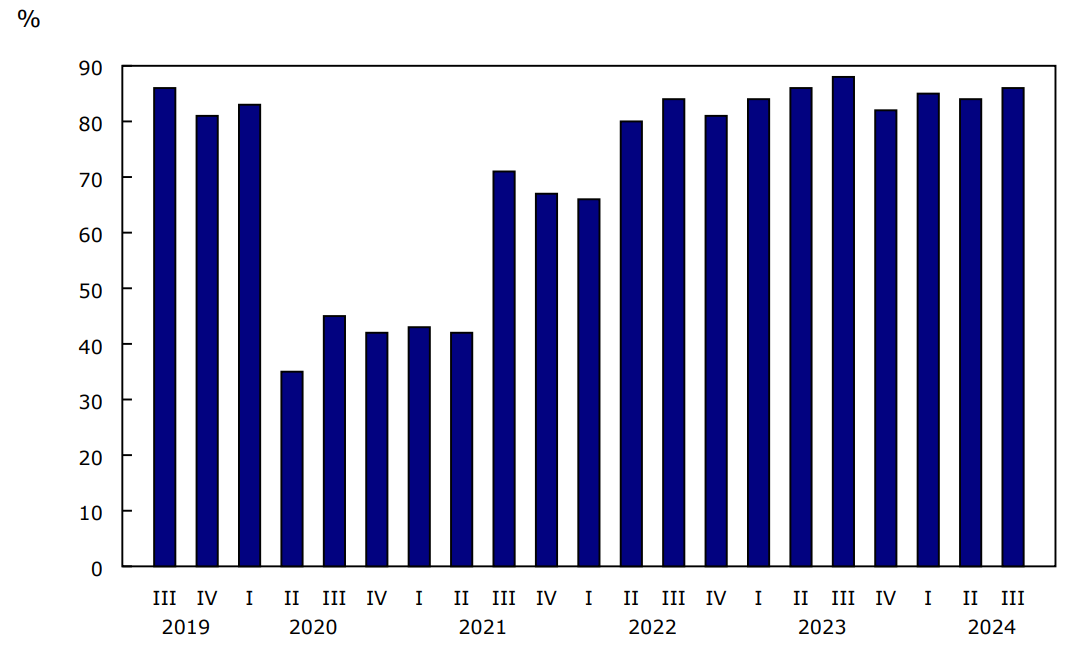
Description - Chart 4
Data table: Passenger load factor, Canadian air carriers
Source: Table 23-10-0258-01.
Note to readers
This release covers Canadian Level I and II air carriers. The number of air carriers remained 24 in 2024; however, one Level II air carrier was reclassified to Level I.
Level I air carriers include every Canadian air carrier that, in the calendar year before the year in which information is provided, transported at least 2 million revenue passengers or at least 400 000 tonnes of cargo.
Level II air carriers include every Canadian air carrier that, in the calendar year before the year in which information is provided, transported (a) at least 100,000, but fewer than 2 million, revenue passengers, or (b) at least 50 000 tonnes, but fewer than 400 000 tonnes, of cargo.
Net non-operating income and loss are from commercial ventures that are not part of the air transportation services, from other revenues and expenses attributable to financing or other activities that are not an integral part of air transportation, and from special recurrent items of a non-periodic nature. Provision for income taxes is also included. Non-operating income can be, for example, capital gains from the sale of aircraft, interest income and foreign exchange adjustment, while non-operating expenses can include capital losses and interest on bank loans and other debt.
Data in this release are not seasonally adjusted.
Survey data are revised on a quarterly basis to reflect new information.
Because of rounding, components may not add up to the total.
Reference
Data tables: Access the latest tables.
- Note: some data tables may best be viewed on desktop.
Definitions, data sources and methods: survey number 2712.
Previous release: Quarterly civil aviation statistics, second quarter 2024.
Contact information
For more information, or to enquire about the concepts, methods or data quality of this release, contact us (toll-free 1-800-263-1136; 514-283-8300; infostats@statcan.gc.ca) or Media Relations (statcan.mediahotline-ligneinfomedias.statcan@statcan.gc.ca).