

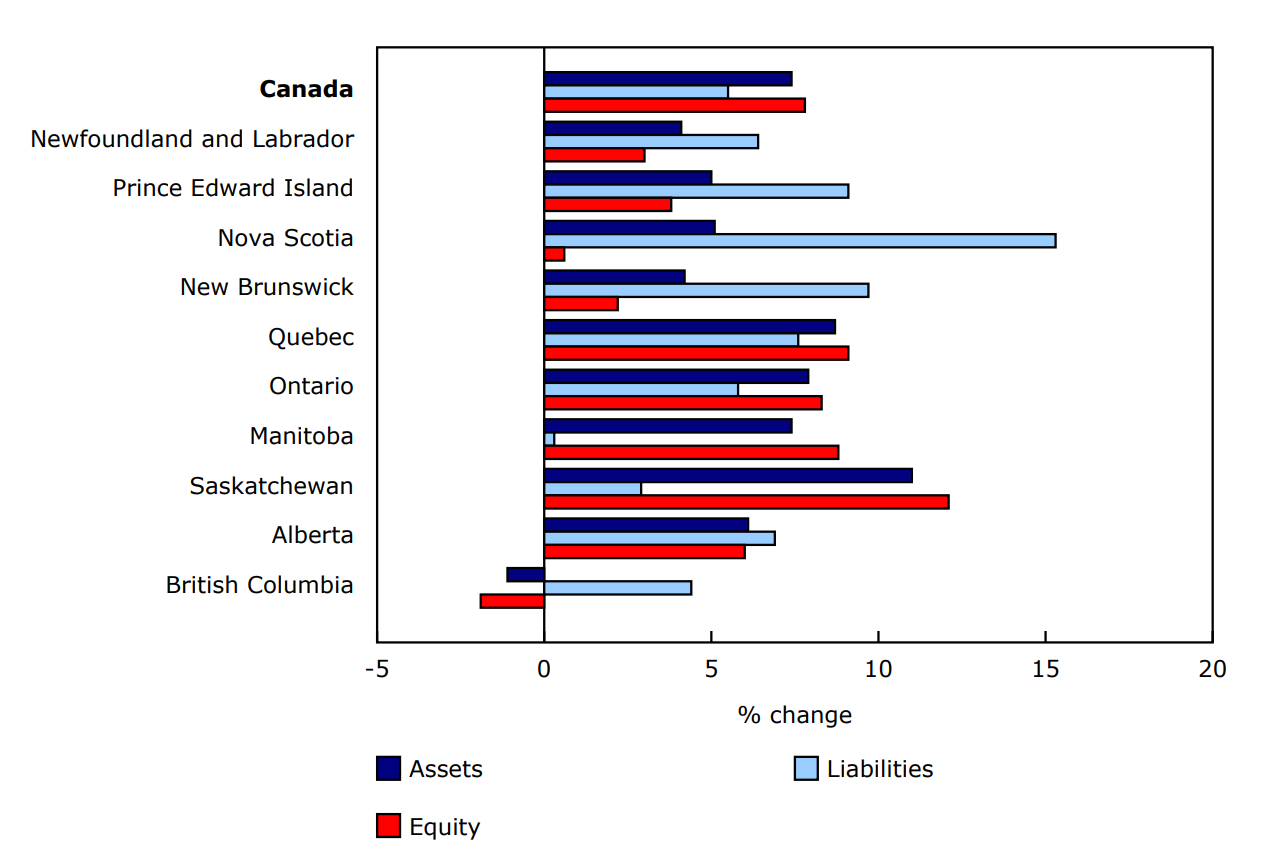
The value of equity in Canada's farm sector totalled $788.3 billion as of December 31, 2023, up $57.0 billion (+7.8%) from the same date one year earlier, building on two years of double-digit gains.
Every province recorded growth in farm equity as of December 31, 2023, except British Columbia (-1.9%). Equity gains in Saskatchewan (+12.1%) and Ontario (+8.3%) together accounted for more than 60% of the national rise.
Chart 1: Year-over-year percentage change in the value of total assets, total liabilities and equity, 2022 to 2023
Description - Chart 1
Data table: Year-over-year percentage change in the value of total assets, total liabilities and equity, 2022 to 2023
Source: Table 32-10-0056-01.
Farm real estate drives the increase in total assets value
The value of total assets grew $64.3 billion (+7.4%) to $927.2 billion as of December 31, 2023. Almost all of this increase was the result of gains in farm real estate, which was up $60.4 billion (+9.0%). The value of farm real estate rose in every province, except British Columbia (-2.0%). Ontario led the increases, posting a gain of $19.3 billion (+9.4%) to $225.3 billion.
A strong increase in farmland value was responsible for much of the rise in the value of farm real estate. According to Farm Credit Canada, 2023 marked the second consecutive year of double-digit increases in the average value of farmland, with the gain in 2023 being the second largest since 2014. The value of farmland was up in 2023 despite higher interest rates, as steady demand, a limited supply of farmland and higher farm business incomes supported growth.
The value of poultry and market livestock inventories was up $2.2 billion (+20.3%) to $13.1 billion as of December 31, 2023. The increase was attributable to higher prices of poultry and market livestock commodities, as inventory levels for most livestock were down. Alberta (+$1.3 billion), Saskatchewan (+$371.5 million) and Ontario (+$329.2 million) accounted for more than four-fifths of the national gain.
The value of crop inventories was down $5.1 billion (-16.1%) to $26.7 billion as of December 31, 2023, marking the first decline in five years. The decrease was the result of increased crop marketings—which led to lower end-of-year stocks—as well as lower crop prices in 2023 compared with 2022.
Total liabilities rise in all provinces
The value of total liabilities rose $7.3 billion (+5.5%) to $138.9 billion as of December 31, 2023, due to a $6.9 billion gain in long-term liabilities and a $400.0 million gain in current liabilities. Total liabilities grew in every province, with Alberta, Ontario and Quebec accounting for over three-quarters of the national increase.
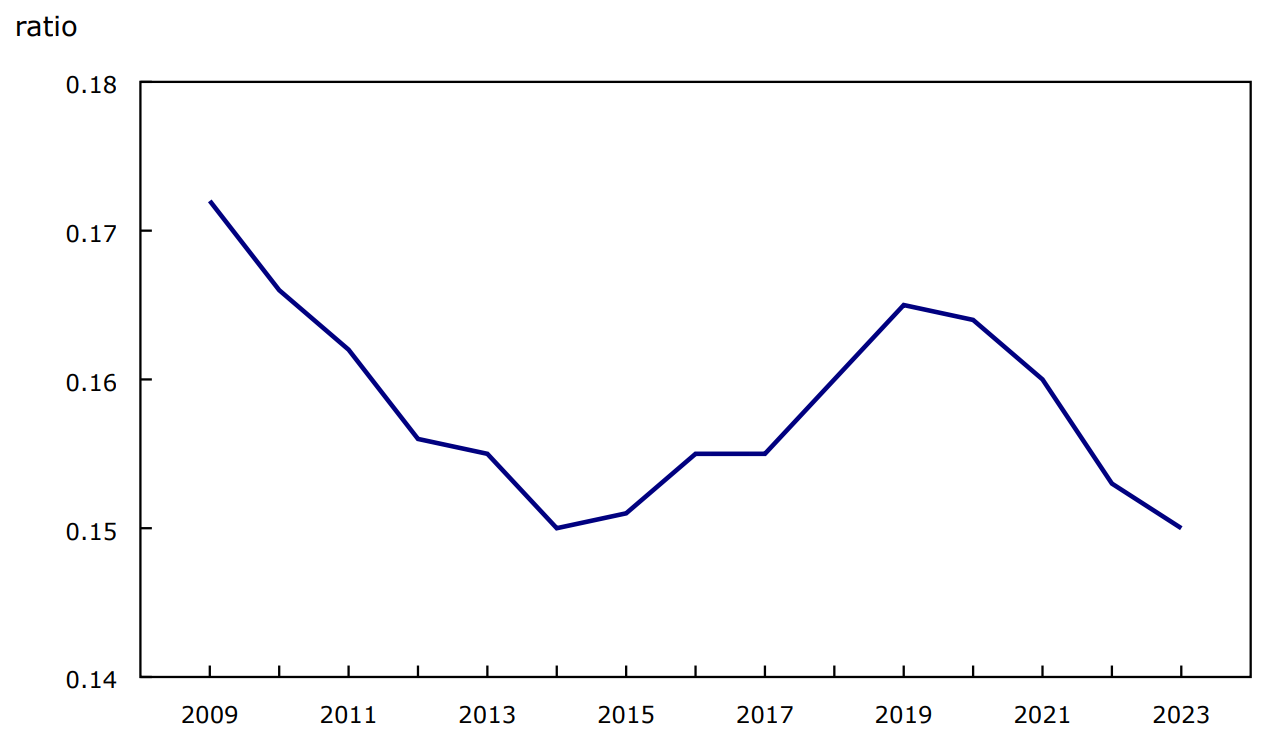
Chart 2: Solvency ratio—debt, Canada, 2009 to 2023
Description - Chart 2
Data table: Solvency ratio—debt, Canada, 2009 to 2023
Note: The debt ratio is calculated as total liabilities divided by total assets.
Source: Table 32-10-0056-01.
Interest coverage ratio declines
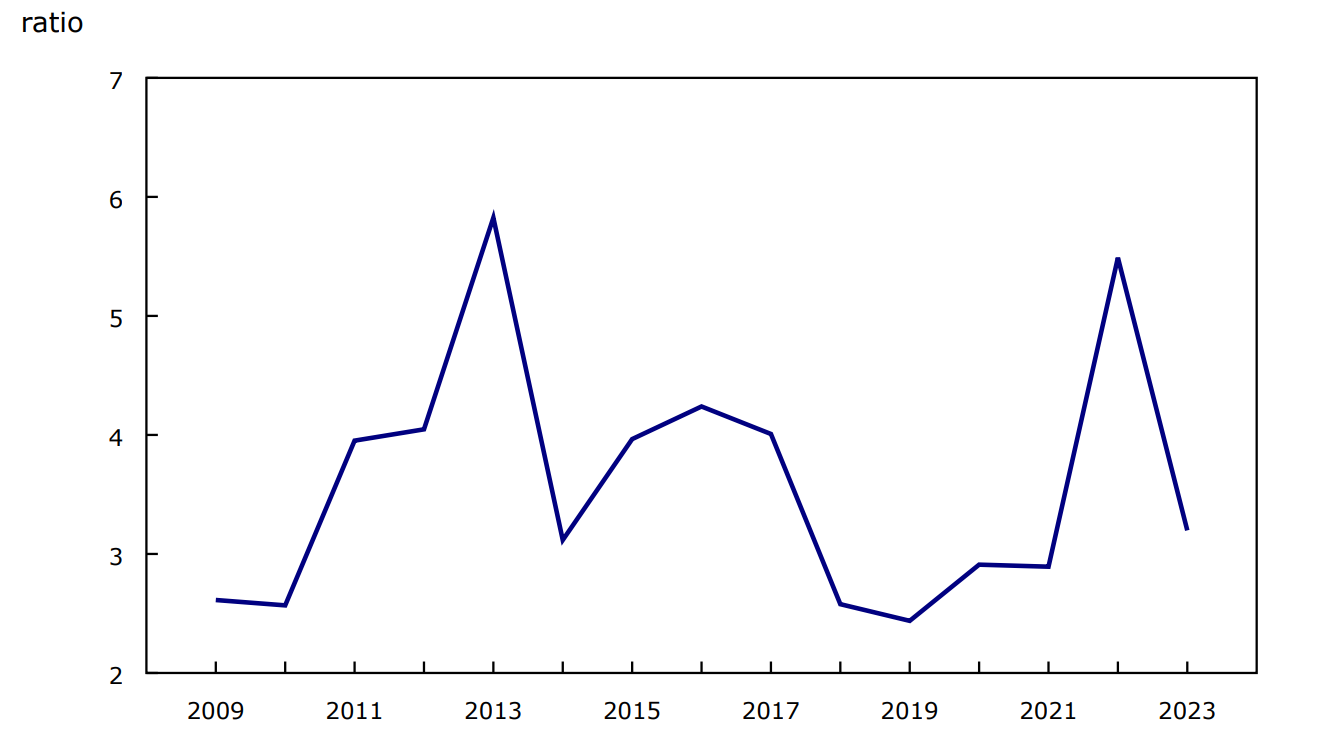
The interest coverage ratio, which measures the ability of a farm business to meet its interest payments, fell from 5.489 in 2022 to 3.198 in 2023. A lower interest coverage ratio (net income before taxes plus interest expense, divided by interest expense) indicates that businesses are less able to repay their debts. The contraction of the ratio was the result of a lower total net income, which was due to the drop in crop inventories, and higher interest rates. Despite the year-over-year decrease, the ratio remained higher than what it was from 2018 to 2021.
Chart 3: Efficiency ratio—interest coverage, Canada, 2009 to 2023
Description - Chart 3
Data table: Efficiency ratio—interest coverage, Canada, 2009 to 2023
Source: Table 32-10-0056-01.
Note to readers
The balance sheet of the agricultural sector provides the value of farm assets used in agricultural production, the liabilities associated with these assets and the farm sector equity as of December 31 for Canada and the provinces.
Assets and liabilities in the balance sheet of the agricultural sector include those of farm businesses and non-operator landlords (for farm real estate assets leased to farm operators and the corresponding liabilities) and exclude the personal portion of farm households. This most closely reflects the assets and liabilities used in agricultural production.
The balance sheet of the agricultural sector integrates data already produced by Statistics Canada, such as farm debt, value of farm capital, livestock and crop estimates, farm product prices, and selected data from the Farm Financial Survey. These data are subject to revision.
For the latest information on the Census of Agriculture, visit the Census of Agriculture portal.
For more information on agriculture and food, visit the Agriculture and food statistics portal.
Reference
Data table: 32-10-0056-01.
- Note: some data tables may best be viewed on desktop.
Definitions, data sources and methods: survey number 5029.
Previous release: Balance sheet of the agricultural sector, December 31, 2023.
Contact information
For more information, or to enquire about the concepts, methods or data quality of this release, contact us (toll-free 1-800-263-1136; 514-283-8300; infostats@statcan.gc.ca) or Media Relations (statcan.mediahotline-ligneinfomedias.statcan@statcan.gc.ca).