
Highlights
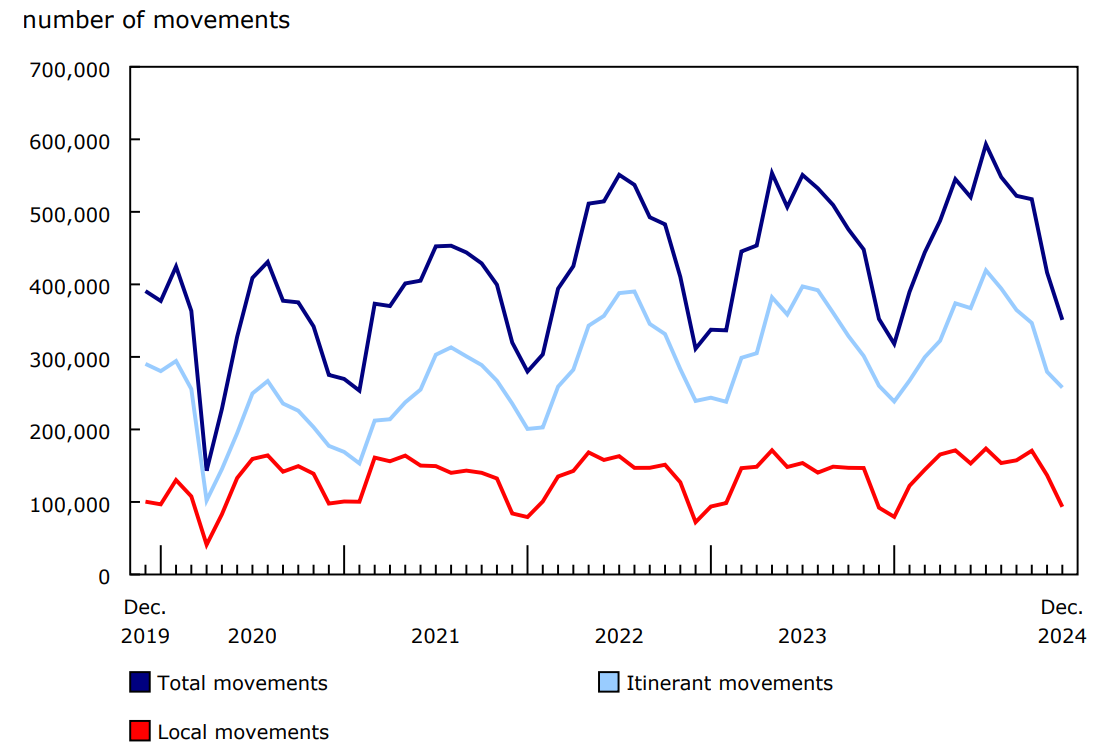
In December, Canada's major and select small airports recorded a total of 351,072 aircraft movements, down slightly (-0.4%) from December 2023. Itinerant movements decreased 1.0% year over year in December 2024, while local movements rose 1.3%.
During 2024, there were a total of 5.7 million aircraft movements at Canada's major and select small airports. This was 2.7% higher than in 2023 and represented 92% of the movements recorded in 2019.
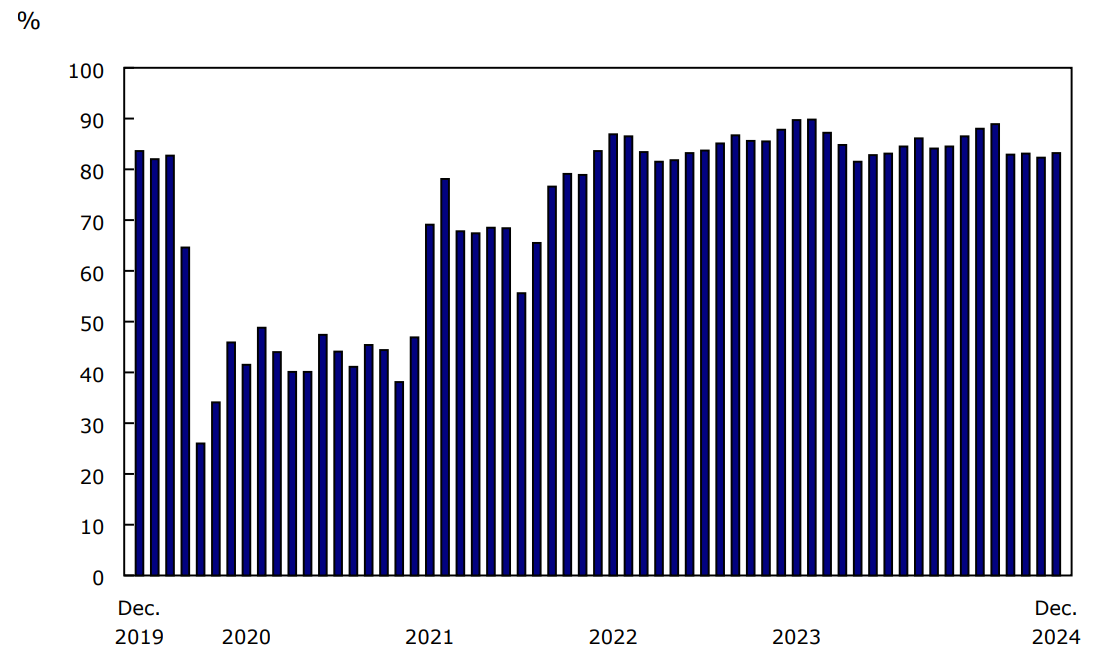
Major Canadian airlines flew 7.3 million passengers on scheduled and charter services in December 2024, with a passenger load factor of 83.2%.
Consult the Aviation Data Visualization Hub to explore aircraft movement statistics and monthly civil aviation statistics in an interactive format.
Other international movements continue to trend upwards in December
In December, other international traffic (outside the United States) (+0.9%) posted a slight gain from December 2023, continuing the series of consecutive monthly year-over-year increases that began in April 2021. In addition, the 18,583 movements in December 2024 surpassed the pre-COVID-19 pandemic level from December 2019 by 12.1%.
For a second consecutive month, year-over-year declines were recorded in both domestic (-1.2%) and transborder (to and from the United States) (-0.7%) movements in December 2024. Decreases in flight school activity at London International (-36.7%) and Oshawa (-26.7%) contributed to the decline in domestic activity. Transborder movements dipped slightly to 33,883.
Chart 1: Total aircraft movements at major and select small airports, by class of operation
Description - Chart 1
Data table: Total aircraft movements at major and select small airports, by class of operation
Source: Table 23-10-0296-01.
2024 in review: wildfires and uneven recovery in aircraft movements
Following the record-breaking wildfire season of 2023, preliminary estimates from the Canadian National Fire Database place the 2024 wildfire season as the second largest in terms of hectares burned in almost 30 years. Several communities, mostly in Western Canada, were subject to evacuation orders and alerts throughout the summer of 2024, while aircraft across the country, including helicopters and air tankers from smaller carriers (Level IV to VI), were deployed to combat the wildfires.
Total itinerant movements rose 1.7% to 3.9 million in 2024, led by growth in international traffic. Transborder movements increased 5.4% year over year to 434,539, as several routes that had been cancelled during the pandemic were restarted and other new routes were introduced. Other international activity also increased—up 9.6% to 201,295—and, for the first time, exceeded the pre-pandemic level from 2019. In contrast, domestic movements edged up 0.8% year over year to 3.3 million in 2024.
Major airlines' operating and financial statistics
The seven Canadian Level I air carriers flew 7.3 million passengers on scheduled and charter services in December 2024, 8.3% more than in December 2023, when there were six Level I carriers.
The number of passenger-kilometres in December 2024 was 19.6 billion, with a capacity of 23.5 billion available seat-kilometres. As a result, the passenger load factor (the ratio of passenger-kilometres to available seat-kilometres) was 83.2%, slightly above the 82.8% recorded in the same month one year earlier.
Chart 2: Passenger load factor, Canadian air carriers, Level I
Description - Chart 2
Data table: Passenger load factor, Canadian air carriers, Level I
Source: Table 23-10-0079-01.
Each passenger travelled an average of 2,673 kilometres in December, the same as in December 2023.
Level I carriers flew 192,000 hours in December 2024 and generated $2.9 billion in total operating revenue.
In 2024, Canadian Level I air carriers transported 87.4 million passengers. The overall passenger load factor for the year was 84.9%, down from 86.0% in 2023. With the exception of November and December, the 2024 monthly load factors were below those from the same months in 2023.
Note to readers
As of reference month January 2024, Statistics Canada publishes a new consolidated monthly release called "Aircraft movement and civil aviation statistics." The new release covers the following survey programs:
- Aircraft movement statistics (survey number 2715, tables 23-10-0296-01 to 23-10-0304-01)
- Monthly civil aviation statistics (survey number 5026, table 23-10-0079-01).
The tables associated with the above survey programs remain unchanged and will be updated as usual. Definitions, data sources and methods for each survey program remain accessible through each survey's respective number.
Consult the Aviation Data Visualization Hub to explore data from Aircraft movement statistics and Monthly civil aviation statistics in an interactive format.
The aviation statistics program uses respondent (Monthly civil aviation statistics) and administrative (Aircraft movement statistics) data.
An aircraft movement is defined as a take-off, landing or simulated approach by an aircraft, as defined by NAV CANADA.
An itinerant movement is the initial take-off or the final landing of an aircraft.
A local movement is an aircraft conducting the following airport activities: touch-and-go, stop-and-go, simulated approach without landing, low approach, pull up while on final approach or missed approach. Local movements are often carried out during training flights (touch-and-go), equipment tests, etc.
On July 11, 2024, the flight service station at Peace River, British Columbia, was officially closed. Starting in August 2024, movements for Peace River Airport are excluded from the Aircraft movement statistics. Data prior to August 2024 will continue to be available.
The Monthly Civil Aviation Survey covers all Canadian Level I air carriers: Air Canada (including Air Canada Rouge), Air Transat, Flair, Jazz, Porter, Sunwing and WestJet (including WestJet Encore and WestJet Link). The number of air carriers increased from six in 2023 to seven in 2024 because one Level II air carrier was reclassified to Level I.
The average passenger trip length is calculated by dividing the number of passenger-kilometres by the number of passengers. Trips across Canada and around the world are included in this calculation.
The data in this monthly release are not seasonally adjusted.
Data are subject to revisions.
Reference
Data tables: Access the latest tables.
- Note: some data tables may best be viewed on desktop.
Definitions, data sources and methods: survey numbers 2715 and 5026.
Previous release: Aircraft movement and civil aviation statistics, November 2024.
Contact information
For more information, or to enquire about the concepts, methods or data quality of this release, contact us (toll-free 1-800-263-1136; 514-283-8300; infostats@statcan.gc.ca) or Media Relations (statcan.mediahotline-ligneinfomedias.statcan@statcan.gc.ca).