

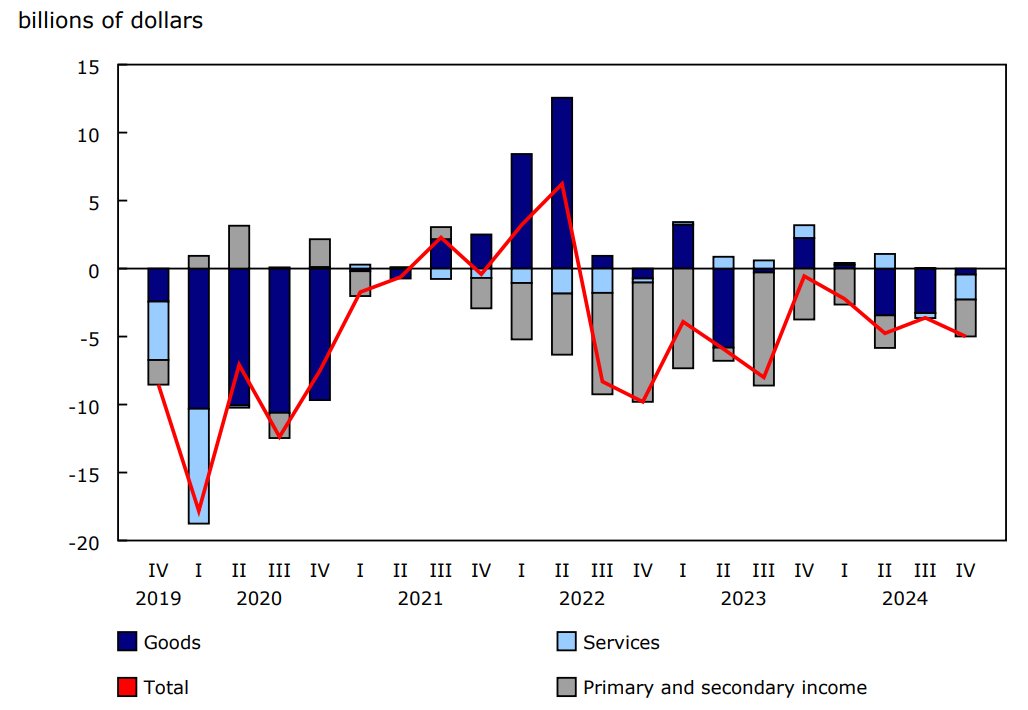
Canada's current account balance (on a seasonally adjusted basis) posted a $5.0 billion deficit in the fourth quarter, widening $1.4 billion from the previous quarter. This was the largest current account deficit since the third quarter of 2023 (-$8.0 billion). The widening of the deficit in the fourth quarter of 2024 reflected a narrowing of the investment income surplus alongside a higher trade in services deficit. These movements were partially offset by a lowering of the goods deficit. The fourth quarter marked the 10th consecutive quarter in which the current account balance was in a deficit position.
In the financial account (unadjusted for seasonal variation), inflows of funds from abroad to finance the current account deficit in the fourth quarter came primarily from foreign investment in Canadian debt securities as non-resident investors significantly increased their holdings of federal government instruments in the quarter.
Current account
Trade in services deficit widens, while trade in goods deficit narrows
The trade in goods and services balance posted a $2.3 billion deficit in the fourth quarter, a decrease of $1.4 billion from the third quarter. The trade in goods deficit narrowed by $2.8 billion to $0.4 billion in the fourth quarter. Meanwhile, the trade in services deficit widened by $1.5 billion to $1.8 billion, primarily as a result of a decline in the travel services surplus.
Exports and imports of goods post significant gains
Exports of goods increased 4.6% to $201.2 billion in the fourth quarter, led by higher exports of metal products (+12.9%), energy products (+5.3%), and consumer goods (+5.2%). The main contributors to each of those product categories were gold, crude oil, and electric vehicle batteries, respectively.
Imports of goods were up 3.0% to $201.6 billion in the fourth quarter. Consumer goods (+4.5%), metal ores (+27.4%) and motor vehicles and parts (+2.3%) were the main contributors to the overall increase.
Services exports decline while services imports increase
Services exports fell 1.0% to $53.8 billion in the fourth quarter while services imports increased 1.7% to $55.6 billion. Travel services contributed the most to these changes, as expenditures by foreign students in Canada (exports) declined and travel expenditures by Canadians in other countries (imports) increased. As a result, the travel services surplus narrowed to $0.9 billion in the fourth quarter. Travel exports peaked in the first quarter of 2024 at $17.6 billion, after which new issues of study permits in Canada declined.
Commercial services imports increase
Imports of commercial services increased 0.4% to $29.9 billion in the fourth quarter, largely due to higher payments of computer services (+11.6%) and financial services (+3.5%), while technical and trade-related services (-7.6%) and royalties (-4.8%) fell. Exports of commercial services edged up 0.1% to $31.2 billion in the fourth quarter, with financial services (+2.0%) as the main contributor.
Investment income surplus narrows
The investment income surplus narrowed to $1.0 billion in the fourth quarter, led by a significant increase in profits earned by foreign direct investors on their assets in Canada combined with higher payments of interest and dividends paid to foreign portfolio investors. Profits earned by Canadian direct investors on their assets abroad rose for the fourth consecutive quarter, particularly in the financial sector, but were below highs posted in the fourth quarter of 2023.
Chart 1: Current account balances
Description - Chart 1
Data table: Current account balances
Note: Data are seasonally adjusted.
Source: Table 36-10-0018-01.
Financial account
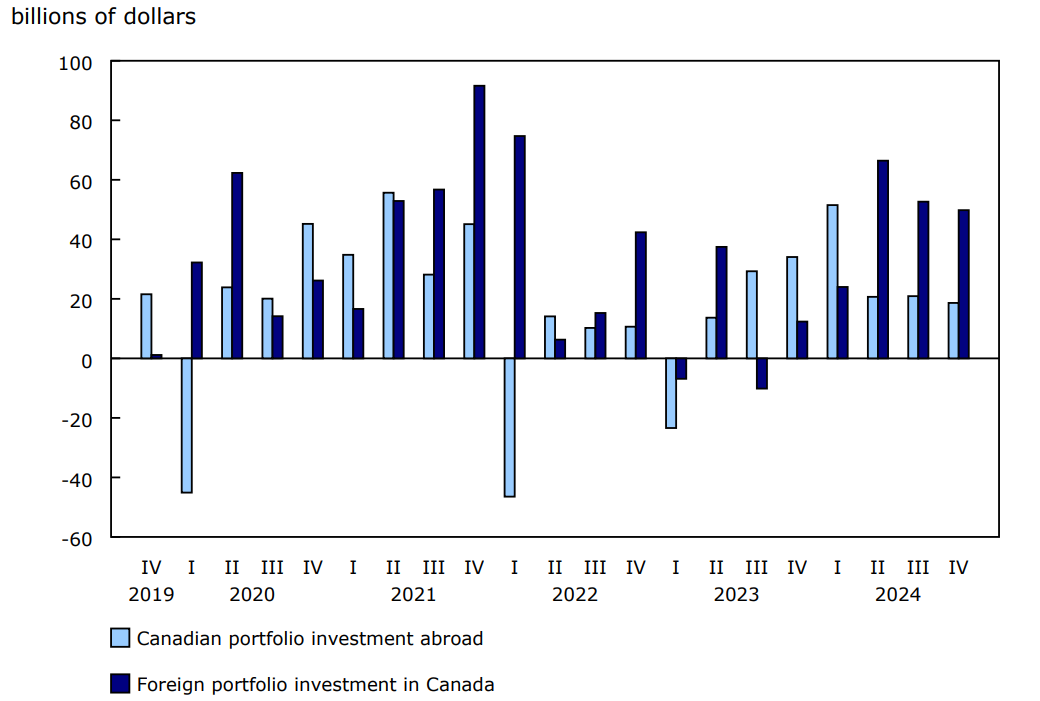
Record foreign acquisitions of federal government debt securities
Foreign investors increased their holdings of Canadian securities by $49.8 billion in the fourth quarter of 2024. Investors increased their exposure to federal government debt securities by an unprecedented $44.9 billion, with sizable investments in both short- and long-term instruments.
Meanwhile, Canadian investors acquired $18.6 billion of foreign securities in the fourth quarter, a level comparable with the $20.9 billion investment of the previous quarter. In the fourth quarter, investors reduced their exposure to foreign shares (-$4.8 billion) but increased their holdings of debt securities (+$23.4 billion), mostly non-US foreign bonds.
Chart 2: Foreign portfolio investment
Description - Chart 2
Data table: Foreign portfolio investment
Source: Table 36-10-0472-01.
As a result, portfolio investments generated a net inflow of funds (+$31.2 billion) in the Canadian economy in the fourth quarter.
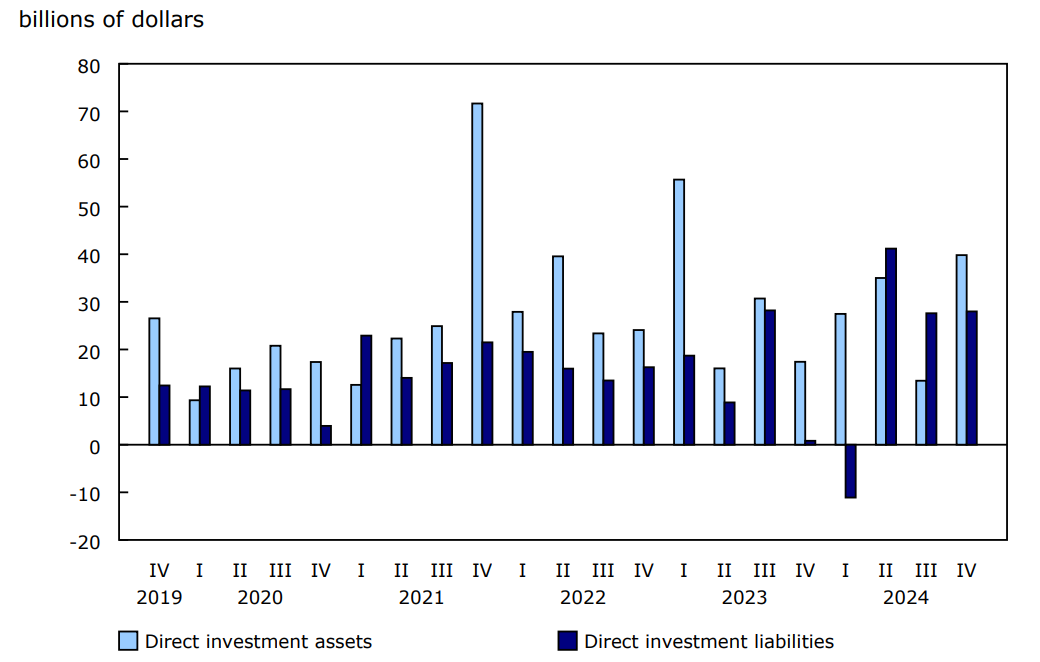
Canadian direct investment abroad increases
Direct investment abroad reached $39.8 billion in the fourth quarter, up from $13.4 billion in the previous quarter. Earnings reinvested in foreign affiliates (+$18.0 billion) and merger and acquisition transactions (+$15.0 billion) led the investment activity. On a sector basis, most of the direct investment abroad was in the finance and insurance and the management of companies and enterprises sectors. On a country basis, the investment was mainly directed to the United States (+$22.1 billion) and the United Kingdom (+$6.8 billion).
Direct investment in Canada totalled $28.0 billion in the fourth quarter, a level comparable to the previous quarter. Merger and acquisition transactions (+$14.9 billion) led the investment activity. The manufacturing sector (+$11.4 billion) was the largest recipient of the foreign direct investment in the fourth quarter, followed by the finance and insurance sector (+$7.7 billion). On a country basis, most of the quarterly flows originated from the United States (+$20.4 billion).
Chart 3: Foreign direct investment
Description - Chart 3
Data table: Foreign direct investment
Source: Table 36-10-0472-01.
Year 2024 in review
Current account deficit shrinks
For the year 2024, the current account balance posted a $15.6 billion deficit, a narrowing of $2.8 billion compared with 2023. The reduction of the deficit was largely due to the investment income surplus increasing from $0.7 billion in 2023 to $8.4 billion in 2024, as higher profits earned by Canadian investors abroad outpaced payments.
The trade in goods deficit widened from $0.6 billion in 2023 to $6.9 billion in 2024. Total imports of goods rose 1.9% to reach $785.4 billion in 2024 on widespread increases led by consumer goods (+$7.6 billion), moderated by lower imports of energy products (-$5.5 billion).
Total exports of goods increased 1.1% to reach $778.6 billion in 2024. Higher exports of metal products (+$10.4 billion), mainly gold, and consumer goods (+$5.4 billion) were partially offset by lower exports of motor vehicles and parts (-$7.3 billion). Within the energy products category, exports of crude oil (+$8.3 billion) increased significantly in 2024, following the completion of the Trans Mountain pipeline expansion project in May, but were partially offset by lower exports of natural gas (-$5.0 billion).
Services imports increase by more than exports in 2024
Services imports rose $12.8 billion to $218.7 billion in 2024 while exports increased by $9.2 billion to reach $217.7 billion, resulting in a deterioration of the services balance. Travel services drove import gains in 2024, increasing $6.7 billion to $59.7 billion, of which $6.4 billion was spent in destinations other than the United States. Imports of commercial services and transportation services also posted gains, led by imports from countries other than the United States. Import growth was particularly pronounced from enterprises operating in the European Union.
Travel services (+$6.3 billion to $67.7 billion) and commercial services (+$2.2 billion to $124.8 billion) drove export gains in 2024. Within commercial services, financial services exports increased throughout 2024. While exports of commercial services to the United States edged down 0.6% to $81.0 billion, exports to all other countries—particularly the European Union, the United Kingdom, Mexico, India and China—increased 6.5% to $43.8 billion. Transportation services exports also increased (+$1.0 billion), with gains widespread across all modes (marine, air and land).
Strong foreign direct and portfolio investment in Canada
In the financial account, cross-border transactions in securities generated a net inflow of funds in the economy of $81.1 billion in 2024. Meanwhile, direct investment activity generated a net outflow of funds totalling $30.1 billion.
Foreign investors acquired $192.9 billion of Canadian securities in 2024, a significant increase compared with 2023. Foreign investors reduced their exposure to Canadian equity securities by $7.6 billion but substantially increased their holdings of debt securities (+$200.5 billion). In 2024, foreign acquisitions focused on federal government bonds (+$100.3 billion) and private corporate bonds (+$78.9 billion). Meanwhile, Canadian investors acquired $111.7 billion of foreign securities, largely bonds (+$86.9 billion), and to a lesser degree, equity securities (+$26.3 billion).
Direct investment abroad remained strong and reached $115.7 billion in 2024, on par with the level of the two previous years. The investment in 2024 was mainly in the finance and insurance, trade and transportation, and management of companies and enterprises sectors. More than half of the direct investment abroad was in the United States.
Direct investment in Canada amounted to $85.7 billion in 2024, the largest investment since 2007. Merger and acquisition activity was strong and contributed to half of the investment in the year. The manufacturing sector (+$39.6 billion) was the largest recipient of the inward direct investment and two-thirds of the investment originated from the United States and Switzerland in 2024.
Focus on Canada and the United States
Canada's balance of payments current account is the broadest measure of the country's international economic activity with the rest of the world. The current account measures all cross-border transactions in the form of goods, services, compensation of employees, investment income and transfers.
The analytical usefulness of the current account goes beyond trade in goods. While goods tend to be the largest component on a gross basis, other components of the current account can illustrate the extent and complexity of Canada's economic relationship with the world.
Canada posted a current account deficit of $15.6 billion in 2024 with the rest of the world. On a geographical basis, the current account balance with the United States stood at a surplus of $91.6 billion in 2024 compared with a deficit of $107.2 billion with all other countries.
The current account balance with the United States, while in a surplus position, reflects many underlying movements. The largest surplus is observed for goods where Canada's exports to the United States exceeded imports from the United States by $102.9 billion in 2024.
On the other hand, trade in services generated a deficit position of $12.6 billion with the United States in 2024. The largest contributor to the deficit was travel services. Typically, expenses for Canadians travelling to the United States are much higher than expenses for US residents travelling to Canada.
The other significant component of the current account with the United States is investment income. The difference between payments to US residents on their investment in Canada and receipts by Canadians on their investment in the United States resulted in a deficit position in 2024 (-$3.3 billion).
Important underlying movements are also observed within the investment income component of the current account depending on the nature of the investment between the two countries, notably for direct and portfolio investment. While profits earned by Canadian direct investors on their assets in the United States exceeded profits earned by US direct investors in Canada in 2024, income (dividends and interest) earned by Canadian portfolio investors on their holdings of US securities was much lower than income earned by US investors on their holdings of Canadian securities.
Note to readers
Definitions
The balance of international payments covers all economic transactions between Canadian residents and non-residents in three accounts: the current account, the capital account and the financial account.
The current account covers transactions in goods, services, compensation of employees, investment income and secondary income (current transfers).
The current account data in this release are seasonally adjusted. For information on seasonal adjustment, see Seasonally adjusted data - Frequently asked questions.
The capital account covers capital transfers and transactions in non-produced, non-financial assets.
The financial account covers transactions in financial assets and liabilities.
In principle, a net lending (+) or net borrowing (-) derived from the sum of the current and capital accounts corresponds to a net lending (+) or net borrowing (-) derived from the financial account. In practice, as data are compiled from multiple sources, this is rarely the case and gives rise to measurement error. The discrepancy (net errors and omissions) is the unobserved net inflow or outflow.
Foreign direct investment is presented on an asset-liability principle basis (that is, gross basis) in the financial account. Foreign direct investment can also be presented on a directional principle basis (that is, net basis), as shown in supplementary foreign direct investment tables 36-10-0025-01, 36-10-0026-01, 36-10-0473-01 and 36-10-0656-01. The difference between the two foreign direct investment conceptual presentations resides in the classification of reverse investment, such as (1) Canadian affiliates' claims on foreign parents and (2) Canadian parents' liabilities to foreign affiliates. Under the asset-liability presentation, (1) is classified as an asset and included in direct investment assets, also referred to as direct investment abroad in this text, and (2) is classified as a liability and included in direct investment liability, also referred to as direct investment in Canada in this text.
For more information on the balance of payments, consult, "Chapter 8. International Accounts," in the User Guide: Canadian System of Macroeconomic Accounts, available on Statistics Canada's website. The chapter also presents the most recent balance of payments statistics.
Real-time table
Real-time table 36-10-0042-01 will be updated on March 10. For more information, see Real-time data tables.
Contact information
For more information, or to enquire about the concepts, methods or data quality of this release, contact us (toll-free 1-800-263-1136; 514-283-8300; infostats@statcan.gc.ca) or Media Relations (statcan.mediahotline-ligneinfomedias.statcan@statcan.gc.ca).