

Highlights
In the third quarter, visitors from the United States and overseas countries made 11.1 million trips to Canada, up 6.6% from the same quarter in 2023. From July to September 2024, nearly four out of five non-resident trips (78.5%) were made by US residents.
Meanwhile, spending by non-resident visitors to Canada totalled $11.6 billion in the third quarter, an increase of 8.5% from the same quarter in 2023. The average expenditure stood at $1,038 per trip during the third quarter of 2024.
Trips to Canada by US residents
From July to September 2024, US residents took 8.7 million trips to Canada, up 7.5% compared with the third quarter of 2023, but down 7.6% from the same quarter in 2019, before the COVID-19 pandemic. In the third quarter of 2024, for most of these visitors (86.6%), the main reason for taking these trips was personal. Holidays, leisure or recreation (58.7%) was the most frequently cited personal reason for visiting Canada.
In the third quarter, US residents visiting Canada spent $6.6 billion, a 23.4% increase over the third quarter of 2023 and 43.7% higher than the third quarter of 2019. On average, these visitors spent $760 per trip in the third quarter of 2024, with an average trip length of 3.1 nights.
From July to September, accommodation was the top spending category for US residents visiting Canada, representing 36.3% of all expenditures. Food and beverages were the second-highest spending category (25.2%), followed by transportation (15.5%), and recreation and entertainment (14.0%).
Trips to Canada by overseas residents
In the third quarter, overseas residents (from countries other than the United States) took 2.4 million trips to Canada, up 3.5% from the same quarter in 2023, but 20.1% lower than the third quarter of 2019. In the third quarter of 2024, the most common main purpose for these visitors' trips was visiting friends or relatives (42.2%), followed by holidays, leisure or recreation (40.8%).
The United Kingdom (359,000 visitors) ranked first for the most visitors to Canada in the third quarter, followed by France (266,000) and Germany (161,000). China and Japan were among the countries with the largest year-over-year volume increases, while declines were seen for Mexico and Brazil.
Spending by overseas visitors in Canada totalled $4.9 billion in the third quarter, down by 6.7% from the third quarter of 2023, and 2.2% lower than the same quarter in 2019. From July to September 2024, overseas visitors spent an average of $2,053 per trip, and the average trip length was 15.0 nights.
In the third quarter, the top expenditure category was accommodation, accounting for more than one-third (36.7%) of spending by overseas visitors. It was followed closely by food and beverages (25.0%), while transportation took third place, representing 13.8% of total spending by overseas visitors.
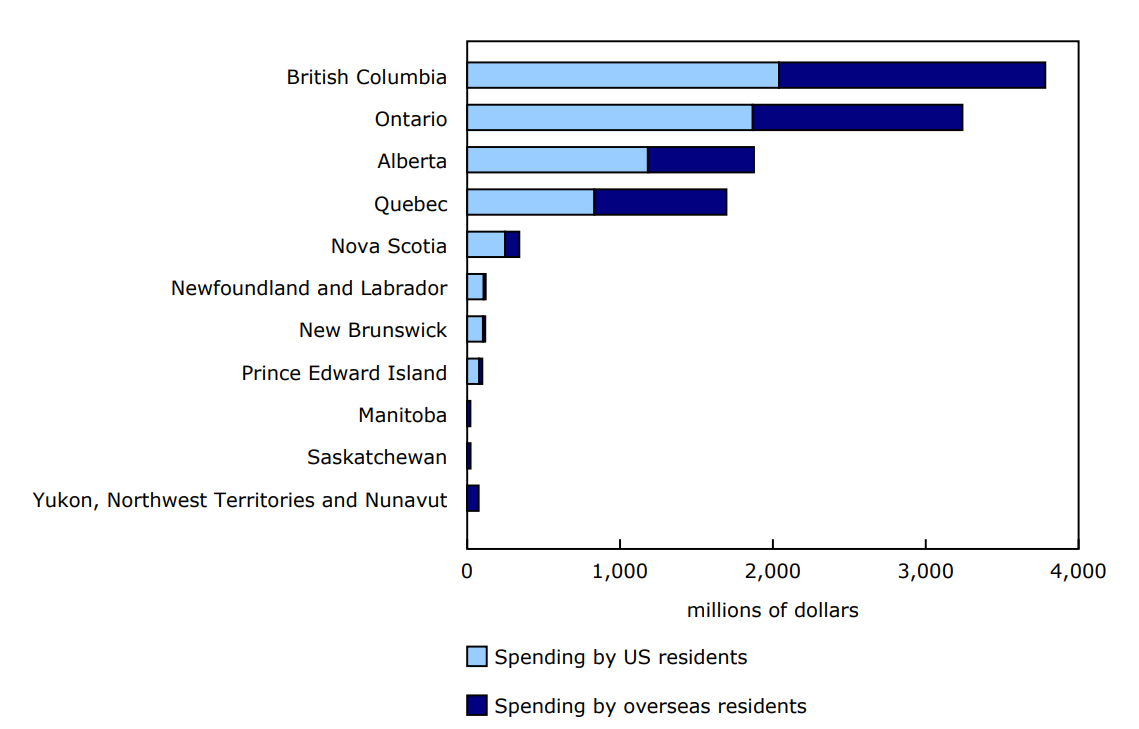
Chart 1: Total travel expenditures by non-resident visitors, by province and territory, third quarter of 2024
Description - Chart 1
Data table: Total travel expenditures by non-resident visitors, by province and territory, third quarter of 2024
Source: Table 24-10-0066-01.
Note to readers
The Visitor Travel Survey (VTS) collects information on US and overseas visitors to Canada.
All data in this release are expressed in current dollars unless otherwise noted.
Readers are encouraged to review the concepts, definitions, data sources, methods, limitations, and summary of changes for the VTS, especially when making historical comparisons and examining specific regions.
Recent data on international travel to Canada are available in the monthly "Travel between Canada and other countries" release.
New tables
Since the first quarter of 2024, new tables are available: 24-10-0064, 24-10-0065 and 24-10-0066. These tables provide data by mode of entry to Canada, for commercial air and mode other than commercial air, and for total visitors to Canada. The following table is archived: 24-10-0047-01 (Spending by foreign residents travelling in Canada by country of residence, tourism region and spending category).
Methodology
Due to the COVID-19 pandemic, collection activity relating to the Visitor Travel Survey (VTS) was suspended in March 2020. VTS collection activities partially resumed in 2023. For the air commercial component, the Air Exit Survey (AES) resumed at five major airports. For the non-air commercial portion, estimates were calculated using a combination of AES data collected and historical non-air commercial data, as well as Frontier Counts.
Starting with the release for the second quarter of 2024, an improved method was used to model trips and spending at the provincial or territorial level for same-day trips by US residents who entered Canada by a mode other than commercial air. As a result, it was possible to better account for the place they visited in Canada. The final estimates in question were revised back to the first quarter of 2023. Estimates of the trips made by residents of countries other than the United States or trips where the mode of entry to Canada was commercial air were not affected.
Starting with the release for the first quarter of 2024, country codes have been aligned with the Variant of the Standard Classification of Countries and Areas of Interest 2022 for Travel Statistics.
It is recommended that users interpret estimates for these quarters with the aforementioned considerations in mind. Comparisons of current VTS estimates with pre-pandemic or pandemic estimates should be made with caution, because different methods were used.
Reference
Data tables: Access the latest tables.
- Note: some data tables may best be viewed on desktop.
Definitions, data sources and methods: survey number 5261.
Previous release: Visitor Travel Survey, second quarter 2024.
Next release: May 30, 2025.
Contact information
For more information, or to enquire about the concepts, methods or data quality of this release, contact us (toll-free 1-800-263-1136; 514-283-8300; infostats@statcan.gc.ca) or Media Relations (statcan.mediahotline-ligneinfomedias.statcan@statcan.gc.ca).