

Today, Statistics Canada released Health of Canadians, 2024. This report offers a comprehensive overview of the state of population health in Canada using the latest data to highlight trends of key health indicators across several sociodemographic characteristics. While the report contains many more indicators of population health, only some key findings are presented below.
Life expectancy increases for the first time in three years
Following three years of decline, Canada's life expectancy at birth rose from 81.3 years in 2022 to 81.7 years in 2023. However, this increase still left life expectancy 0.5 years below the level of 82.2 years observed in 2019, before the COVID-19 pandemic. The rise was greater for males (+0.5 years from 2022 to 79.5 years in 2023) than females (+0.4 years to 83.9 years).
Proportionally fewer Canadians reporting very good or excellent health, especially older adults
While life expectancy has increased, Canadians' perception of their health has declined. Annually from 2015 to 2020, roughly 6 in 10 Canadian adults reported their health as very good or excellent.
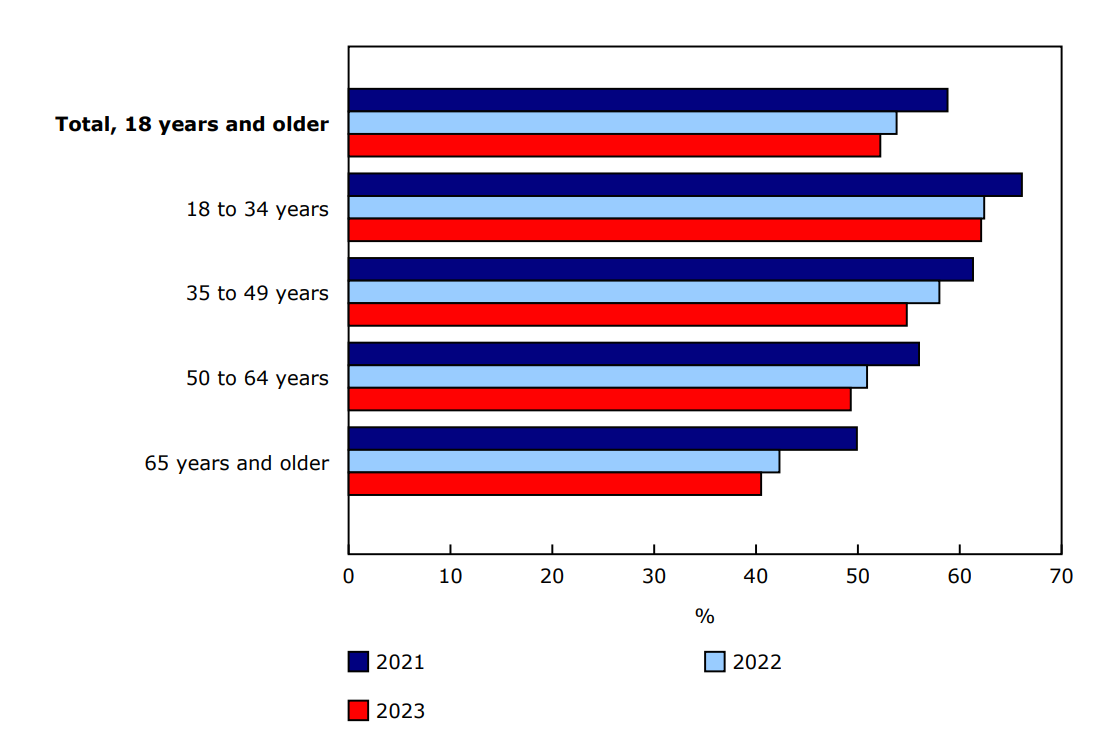
However, this percentage began to drop in 2021 (to 58.8%), and, in 2023, just over 5 in 10 Canadian adults reported their health as very good or excellent (52.2%). The decline in very good or excellent perceived health since 2021 has been especially prominent among those aged 65 and older, from nearly 50% in 2021 to 40.5% in 2023.
Chart 1: Canadians aged 18 years and older reporting very good or excellent perceived health, by age group, 2021 to 2023
Description - Chart 1
Note: Territorial data are not included in annual estimates.
Sources: Canadian Community Health Survey, 2021 to 2023 (3226); Table 13-10-0905-01 Health indicator statistics, annual estimates.
Differences in perceived health among immigrants were observed by time since admission to Canada. For example, in 2023, a higher percentage of immigrants who were admitted to Canada in the last 10 years said they had very good or excellent health (61.1%), compared with immigrants who were admitted more than 10 years ago (47.4%).
Likewise, proportionally more Canadian adults in the highest income quintile (60.9%) reported very good or excellent health, compared with those in the lowest income quintile (42.8%).
Cancer and heart disease remain the leading causes of death, while deaths from COVID-19 decline
Cancer and heart disease remained the leading causes of death, together accounting for 43.7% of deaths in 2023, up from 42.4% in 2022. The top 10 causes of death accounted for 221,147 deaths in 2023, or just over two-thirds (67.8%) of all deaths.
The number of COVID-19 deaths increased from 14,617 in 2021 to 19,906 in 2022, the highest number of deaths since the beginning of the pandemic, then declined by 60% in 2023 to 7,963 deaths.
Table 1: Top 10 leading causes of death, Canada, 2023
Chronic disease more common among adults in rural areas
The prevalence of chronic conditions increases with age, and these conditions significantly impact daily functioning and have a negative effect on quality of life and well-being. Additionally, chronic conditions increase the risk of hospitalization, morbidity and mortality.
The burden of chronic diseases is unevenly distributed across Canada. In 2023, the prevalence of having one or more chronic diseases was higher in the Atlantic provinces (59.0% in Newfoundland and Labrador, 55.8% in Prince Edward Island, 54.2% in Nova Scotia, and 55.0% in New Brunswick) and Manitoba (49.4%) compared with all of Canada excluding the territories (46.1%). The chronic diseases considered in this analysis are arthritis, high blood pressure, diabetes, cancer (ever diagnosed), heart disease (ever diagnosed), stroke and mood disorders.
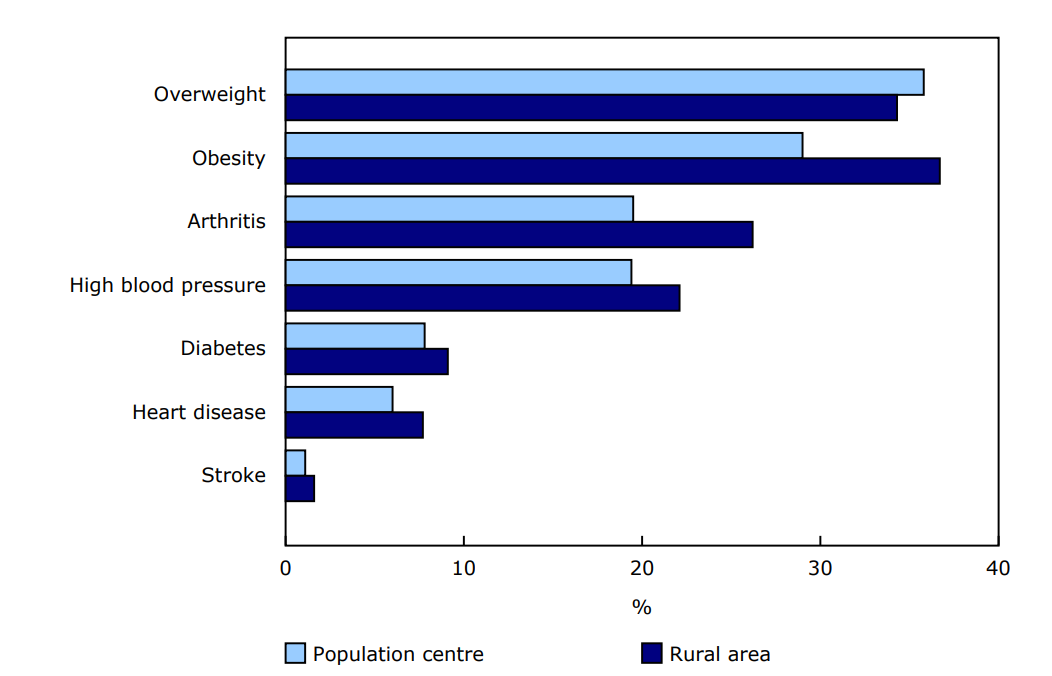
In 2023, rural areas with fewer than 10,000 residents had a higher prevalence of high blood pressure, heart disease, diabetes, obesity and arthritis, compared with those living in larger population centres (at least 10,000 residents).
Chart 2: Prevalence of selected chronic diseases and risk factors among Canadians aged 18 and older, by rural area or population centre, 2023
Description - Chart 2
Notes: Territorial data are not included in annual estimates. A population centre has a population of at least 1,000 and a population density of 400 persons or more per square kilometre, based on population counts from the current Census of Population. All areas outside population centres are classified as rural areas. Body mass index is derived by dividing the respondent's self-reported body weight (in kilograms) by their height (in metres) squared. This excludes pregnant females and people shorter than 3 feet or taller than 6 feet 11 inches. A correction factor is applied to adjust for underestimates in weight and overestimates in height. According to the World Health Organization and Health Canada guidelines, the index for body weight classification for the population aged 18 and older is 25.00 to 29.99 for overweight; 30.00 to 34.99 for obese, class I; 35.00 to 39.99 for obese, class II; and 40.00 or greater for obese, class III. Obesity classes are grouped for the purposes of this analysis.
Source: Canadian Community Health Survey, 2023 (3226).
Proportionally fewer adults in the highest income quintile report daily cigarette smoking and daily or almost daily cannabis use, while a higher proportion are heavy drinkers
The leading causes of death, including cancer and heart disease—as well as other chronic diseases, like chronic respiratory disease and diabetes—share common modifiable risk factors, such as alcohol consumption, smoking, poor diet and lack of physical activity. Since these behaviours are modifiable, they provide an opportunity for prevention or intervention.
Cigarette smoking has been declining in Canada. In 2023, just over 1 in 10 adults (11.4%) reported smoking cigarettes daily or occasionally, down from 12.5% in 2022. Likewise, just over 1 in 20 adults (5.7%) reported daily or almost daily use of cannabis, down from 6.5% a year earlier.
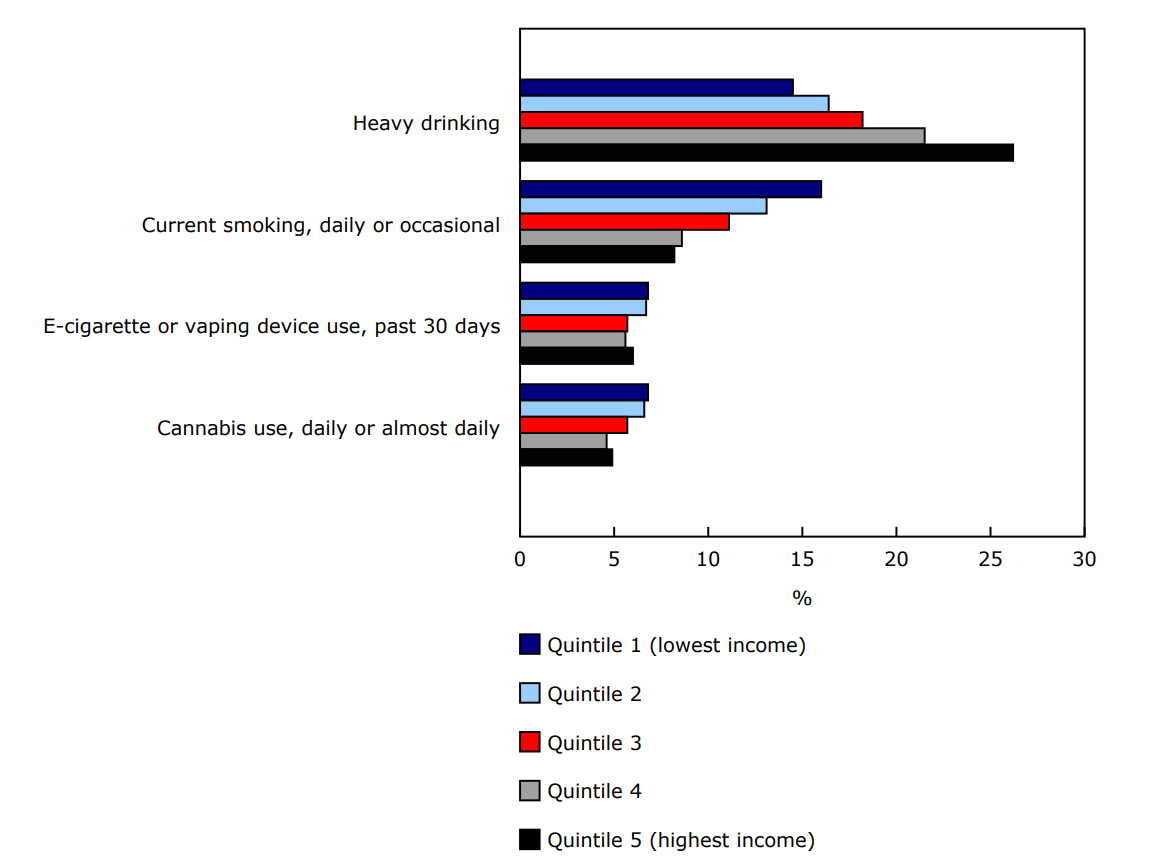
Proportionally more adults in the lowest household income quintile were current smokers, compared with those in the highest quintile (16.0% vs. 8.2%). Similarly, the share of adults using cannabis daily or almost daily was greater in the lowest income quintile compared with the highest quintile (6.8% vs. 4.9%).
Conversely, the proportion of adults reporting heavy drinking in the past year was much higher among those in the highest income quintile (26.2%) than those in the lowest quintile (14.5%).
Chart 3: Heavy drinking, current smoking, e-cigarette or vaping device use, and cannabis use among Canadians aged 18 and older, by household income quintile, 2023
Notes: Territorial data are not included in annual estimates. Heavy drinking is defined as having five or more drinks for men aged 18 and older, or four or more drinks for women, on one occasion, at least once a month in the past year. Daily smokers are those who reported smoking cigarettes every day (excluding alternative smoking products), while occasional smokers are those who reported smoking cigarettes occasionally. This includes former daily smokers who now smoke occasionally.
Sources: Canadian Community Health Survey, 2023 (3226); Table 13-10-0906-01 Health indicator statistics, annual estimates, by household income quintile and highest level of education.
Proportionally fewer Canadians have a regular health care provider, while unmet needs for health care have grown
Having a regular health care provider is important for continuity of care, early detection of health issues and effective management of chronic conditions. It leads to better overall health outcomes. After remaining stable at around 85% from 2017 to 2022, the proportion of Canadian adults who reported having a regular health care provider decreased to 82.8% in 2023. The share was particularly low for adults living in Quebec (74.2%), adults in the lowest income quintile (79.9%), and young adults aged 18 to 34 years old (73.6%).
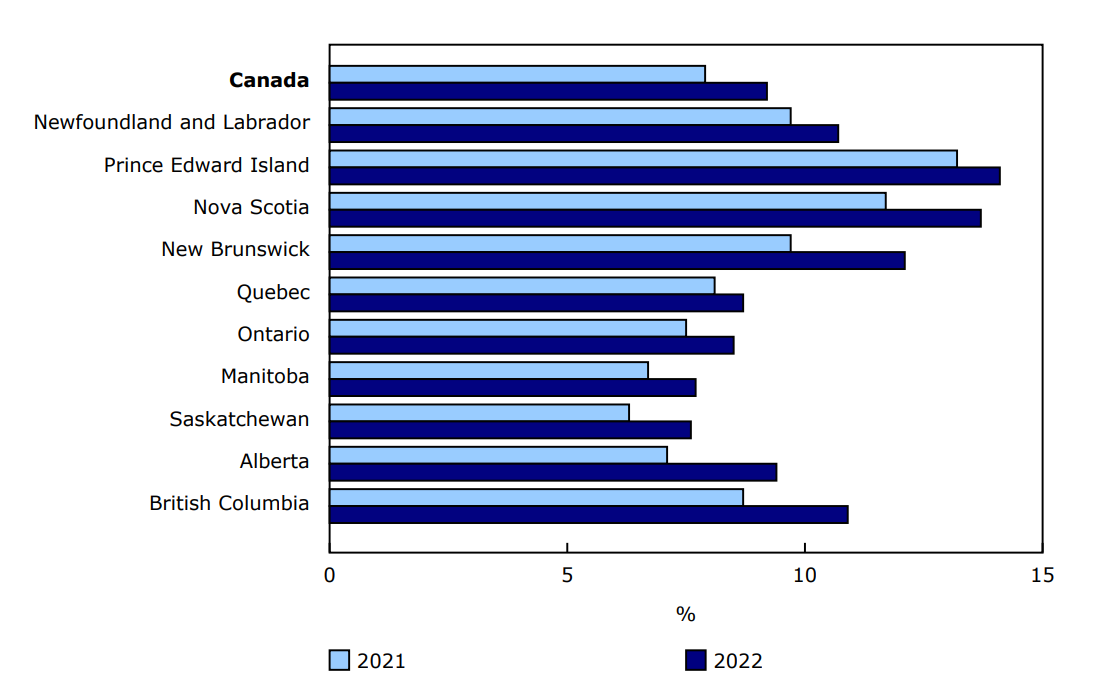
Additionally, nearly 3 million Canadians (9.2% of the population aged 15 years and older) reported having unmet needs for health care in 2022, up 1.3 percentage points from the previous year (7.9%). In 2022, unmet needs for health care continued to vary across provinces, with more people in the Atlantic provinces and British Columbia reporting unmet needs for health care, compared with Canada overall.
Chart 4: Canadians reporting unmet needs for health care, by province, 2021 (aged 16 and older) and 2022 (aged 15 and older)
Description - Chart 4
Notes: Territorial data are not included in annual estimates. The estimate for 2021 is for people aged 16 and older and that for 2022 is for people aged 15 and older because of a change in the target population.
Sources: Canadian Income Survey, 2021 and 2022 (5200); Table 13-10-0836-01 Unmet health care needs by sex and age group.
Note to readers
More information is available in Health of Canadians, 2024, which consolidates data from several Statistics Canada sources. Disaggregated data by geography, sex, age, immigrant status and household income are unadjusted for any factors that could account for the differences across these groups. When two estimates are described as different in this article, the difference is statistically significant at a 95% confidence level (p-value less than 5%).
Very good or excellent perceived health includes respondents who answered "excellent" or "very good" to the question "In general, how is your health?" The question defines health as "not only the absence of disease or injury but also physical, mental and social well-being."
Overweight and obesity are based on self-reported height and weight. A body mass index (weight in kilograms divided by the square of height in metres) of 25.00 to 29.99 is classified as overweight and equal to or above 30.00 is classified as obese for respondents aged 18 or older. The World Health Organization thresholds by age and sex were used for respondents aged 15 to 17 to define obesity. Pregnant females were excluded. A correction factor was applied to adjust for underestimates in weight and overestimates in height.
Heavy drinking is defined as having five or more drinks for men aged 18 and older, or four or more drinks for women, on one occasion, at least once a month in the past year.
Daily smokers are those who reported smoking cigarettes every day (excluding alternative smoking products), while occasional smokers are those who reported smoking cigarettes occasionally. This includes former daily smokers who now smoke occasionally.
E-cigarette use or vaping includes those who reported using an e-cigarette or vaping device in the past 30 days.
Cannabis use includes those who reported using cannabis daily or almost daily in the past 12 months.
A regular health care provider is a health professional that a person regularly consults with when they need care or advice about their health. This can include a family doctor or general practitioner, a medical specialist, a nurse practitioner, or another health care provider. Note: For the 2022 and 2023 cycles of the Canadian Community Health Survey, this indicator is based on the question "Which of the following health care providers do you regularly consult with?" From 2015 to 2021, the question was "Do you have a regular health care provider?"
For household income, residents of each province were distributed into quintiles (five categories including approximately the same percentage of residents for each province) based on the adjusted ratio of their total household income to the low-income cut-off corresponding to their household and community size. This provides, for each respondent, a measure of their household income relative to the household incomes of all other respondents in the same province.
Sex at birth refers to sex assigned at birth. Sex at birth is typically assigned based on a person's reproductive system and other physical characteristics. Gender refers to an individual's personal and social identity as a man, woman or non-binary person (a person who is not exclusively a man or a woman).
Immigrants include people who are, or who have ever been, landed immigrants or permanent residents. They have been granted the right to live in Canada permanently by immigration authorities. Immigrants who have obtained Canadian citizenship by naturalization are included in this category, while non-permanent residents are excluded. Immigrants who were admitted to Canada in the last 10 years, or "recent immigrants," include people who first obtained landed immigrant or permanent resident status on the survey date or in the 10 years before. In 2022, for example, this category includes people who obtained landed immigrant status from 2012 to 2022. Immigrants who were admitted to Canada more than 10 years ago, or "established immigrants," include people who first obtained landed immigrant or permanent resident status more than 10 years prior to the survey date. In 2022, for example, this category includes people who obtained landed immigrant status in 2011 or before. Non-immigrants include people who are Canadian citizens by birth.
A population centre has a population of at least 1,000 and a population density of 400 persons or more per square kilometre, based on population counts from the current Census of Population. All areas outside population centres are classified as rural areas.
Contact information
For more information, or to enquire about the concepts, methods or data quality of this release, contact us (toll-free 1-800-263-1136; 514-283-8300; infostats@statcan.gc.ca) or Media Relations (statcan.mediahotline-ligneinfomedias.statcan@statcan.gc.ca).