
The Physical Flow Account for Plastic Material is an environmental-economic account that estimates the flow of plastic through the Canadian economy. The account provides annual estimates by product category, resin type, and province and territory. The time-series starts in 2012 and now includes 2021.
The flow begins with production, continues with use, and tracks waste and recycling.
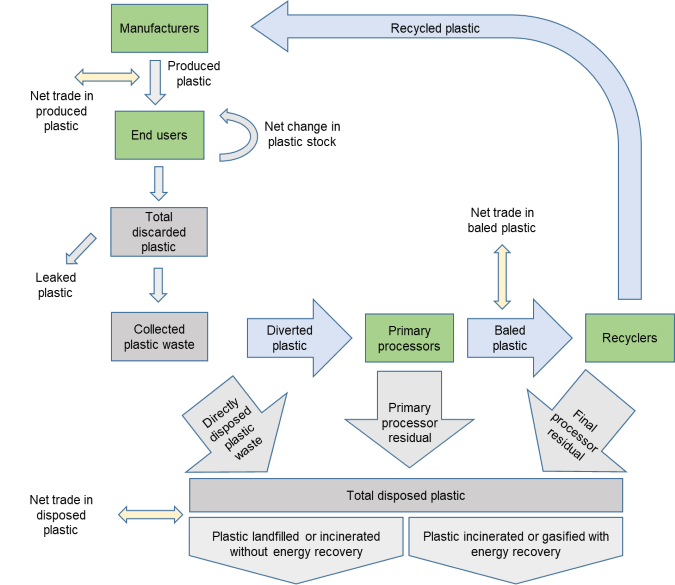
Infographic 1: Flow of plastic through the Canadian economy
Description - Infographic 1
The title of the infographic is "Flow of plastic through the Canadian economy"
The infographic depicts the progression of plastic through production, use, diversion, recycling and disposal.
The flow starts in the upper left-hand corner, where there is a green box labelled "Manufacturers." From this box, a grey arrow labelled "Produced plastic" points down to another green box labelled "End users." One end of a double-ended yellow arrow labelled "Net trade in produced plastic" points toward the middle of the "Produced plastic" arrow.
To the right of the "End users" box, there is a semi-circular arrow labelled "Net change in plastic stock" flowing out of and back into the "End users" box. There is also a grey arrow pointing down from the "End users" box to a grey box labelled "Total discarded plastic."
There is an arrow labelled "Leaked plastic," pointing down and to the left from the left side of the "Total discarded plastic" box. There is also a grey arrow pointing down from the "Total discarded plastic" box to another grey box labelled "Collected plastic waste."
To the right of the "Collected plastic waste" box, there is a blue arrow labelled "Diverted plastic" that points to a green box labelled "Primary processors." There is another blue arrow to the right of the "Primary processors" box labelled "Baled plastic" that points to a green box labelled "Recyclers." One end of a double-ended yellow arrow labelled "Net trade in baled plastic" points towards the middle of the "Baled plastic" arrow.
The "Recyclers" box is in roughly the middle on the right-hand side of the infographic, and there is a curved blue arrow labelled "Recycled plastic" coming out of the top of it that points up and back over to the "Manufacturers" box in the upper left-hand corner.
There are three grey arrows going from left to right and labelled, respectively, "Directly disposed plastic waste," "Primary processor residual" and "Final processor residual" that point downward from the "Collected plastic waste," "Primary processors" and "Recyclers" boxes, respectively, toward a grey box labelled "Total disposed plastic."
There are two grey arrows beside each other pointing down from the bottom of the "Total disposed plastic" box: the one on the left is labelled "Plastic landfilled or incinerated without energy recovery," and the one on the right is labelled "Plastic incinerated or gasified with energy recovery."
Lastly, one end of a double-ended yellow arrow labelled "Net trade in disposed plastic" points toward the space between the "Total disposed plastic" and the "Plastic landfilled or incinerated without energy recovery" boxes.
Packaging, vehicles, and construction materials are the main types of products contributing to changes in Canada's plastic use in 2021
In 2021, the amount of plastic in products produced for Canadian consumption was 7 112 kilotonnes (kt), a level comparable with that seen in 2020 (7 121 kt). This amount includes domestic production and net trade, calculated as imports minus exports, of newly produced products.
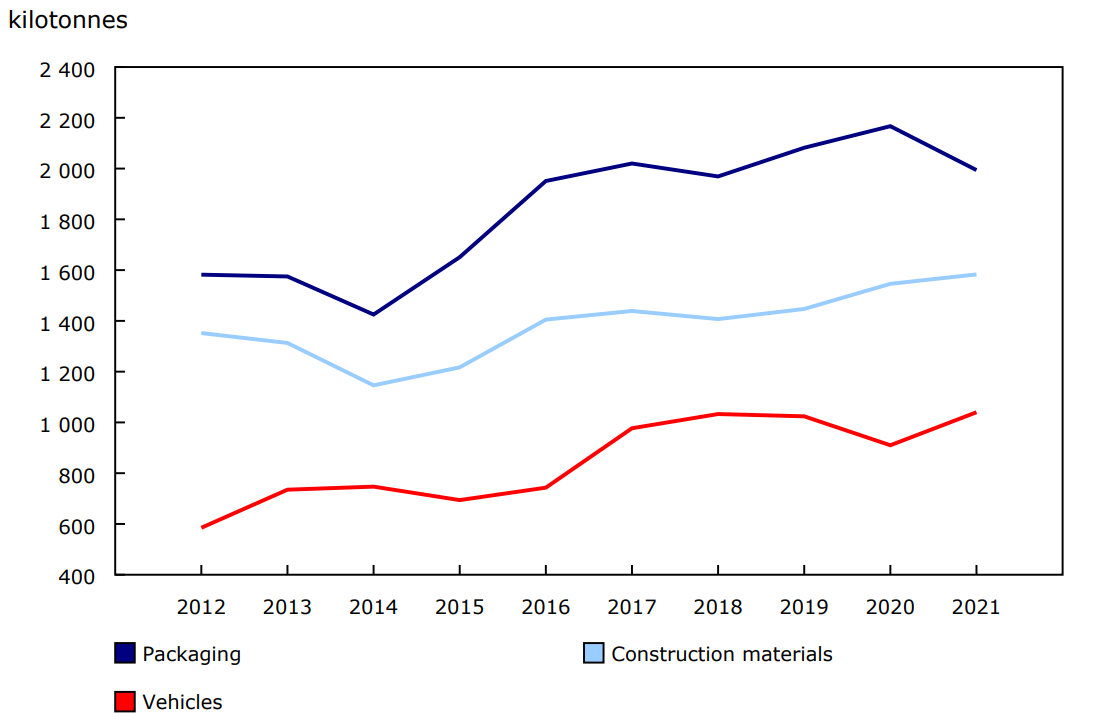
Chart 1: Amount of plastic in products produced for Canadian consumption by selected product category, 2012 to 2021
Description - Chart 1
Data table: Amount of plastic in products produced for Canadian consumption by selected product category, 2012 to 2021
Source: Table 38-10-0150-01.
From 2020 to 2021, the amount of plastic packaging produced for Canadian consumption decreased 8.0% to reach 1 994 kt, driven by a 17.9% drop in net trade of produced plastic packaging. Domestic production of plastic packaging, at 1 207 kt, remained relatively stable in 2021 compared with the previous year.
In contrast, the amount of plastic in vehicles produced for Canadian consumption reached 1 040 kt in 2021, up 14.3% year over year. In 2021, 38.0% of plastic in vehicles was supplied by net trade, an increase from 16.4% in 2020. Domestic production of plastic in vehicles decreased by 15.2% in 2021, as parts supply issues forced Canadian motor vehicle manufacturers to limit production for most of the year. Meanwhile, net trade of produced plastic in vehicles more than doubled, from 150 kt in 2020 to 395 kt in 2021.
The amount of plastic in construction materials produced for Canadian consumption rose 2.4% year over year to 1 583 kt in 2021. Domestic production accounted for 87.6% of plastic in construction materials for Canadian consumption, while net trade accounted for 12.4%. Both contributed to the growth in this category, as domestic production was up by 2.4% and net trade increased by 2.0% from 2020. The rise in produced plastic in construction materials reflected the high demand for residential building construction in 2021.
In 2021, most jurisdictions reported declines in the total amount of plastic in products produced for Canadian consumption, except for Ontario (+5.3%), Yukon (+4.7%) and Prince Edward Island (+4.6%).
Growth in the permanent disposal of plastic outpaces growth in the production of recycled plastic resins ready for use by manufacturers
Canadian households, businesses, and institutions discarded 4 986 kt of plastic in 2021, up 1.3% from 2020. Just over one-quarter (26.5%) of the total amount of plastic discarded within Canada was diverted for material recovery in 2021, totalling 1 319 kt.
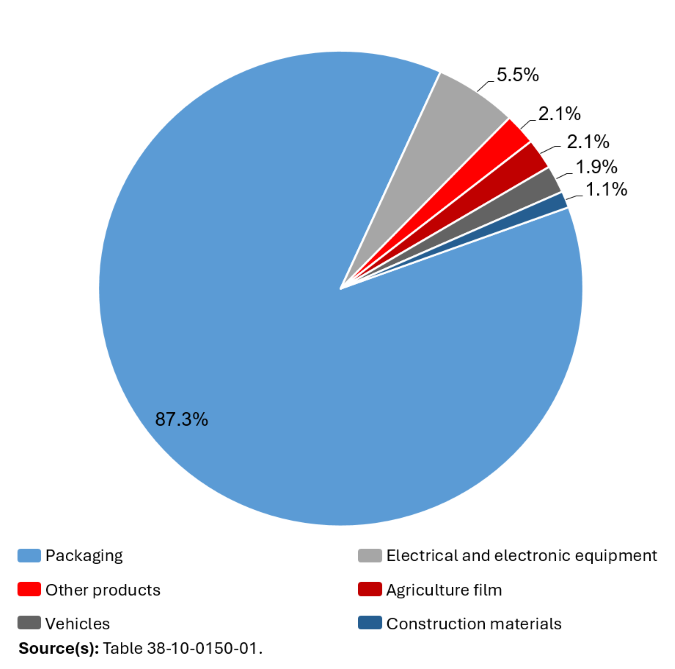
Chart 2: Source of recycled plastic pellets and flakes ready for use in production of new products in Canada, by product category, 2021
Description - Chart 2
The title of the chart is "Source of recycled plastic pellets and flakes ready for use in production of new products in Canada, by product category, 2021"
The chart is a pie chart depicting all product categories that contributed to the total amount of recycled plastic pellets and flakes available for use in the production of new products in Canada in 2021. These categories are packaging, electrical and electronic equipment, other products, agriculture film, vehicles, and construction materials. The pie chart is positioned in the center, with the legend centred below the chart.
The packaging category, which represents 87.3% of the total amount of recycled plastic pellets and flakes ready for use in production, is shown in light blue.
The electrical and electronic equipment category, which represents 5.5% of the total amount of recycled plastic pellets and flakes ready for use in production, is shown in light grey.
The other products category, which represents 2.1% of the total amount of recycled plastic pellets and flakes ready for use in production, is shown in bright red.
The agriculture film category, which represents 2.1% of the total amount of recycled plastic pellets and flakes ready for use in production, is shown in dark red.
The vehicles category, which represents 1.9% of the total amount of recycled plastic pellets and flakes ready for use in production, is shown in dark grey.
The construction materials category, which represents 1.1% of the total amount of recycled plastic pellets and flakes ready for use in production, is shown in dark blue.
Source: Table 38-10-0150-01.
Canadian recyclers produced 365 kt of recycled plastic resins ready for use by manufacturers in 2021, up 1.3% from 2020. Material from plastic packaging increased by 6 kt, accounting for 87.3% of all recycled plastic resins in Canada in 2021, with plastic bottles representing 70.0% of that category. Conversely, electrical and electronic equipment, the second most recycled product, declined by 3 kt in 2021.
The largest contributors to the overall growth in recycled plastic resins in 2021 were polyethylene terephthalate (PET) resin (+16.0%) and other polyethylene resin (+3.4%).
Chart 3: The proportion of total disposed plastic waste, by waste stream, 2012 to 2021

Description - Chart 3
Data table: The proportion of total disposed plastic waste, by waste stream, 2012 to 2021
Canadians permanently disposed of 4 594 kt of plastic in 2021, up 1.7% from 2020. Of this total, almost four-fifths (78.9%) were directly disposed of and not diverted, while the residual plastic of primary and final processors that prepare recycled plastic resins for manufacturers accounted for the remaining one-fifth (21.1%). Despite accounting for a smaller share, residual plastic waste and scrap from primary (+10.1%) and final (+2.1%) processors both led to the increase in total plastic disposal.
Note to readers
The Physical Flow Account for Plastic Material (PFAPM) was created to support the Government of Canada's Zero Plastic Waste Agenda.
The PFAPM accounts for the plastic content of internationally imported and exported products, as well as international imports and exports of sorted and baled plastic waste and disposed plastic waste and scrap. The PFAPM does not account for international trade of recycled plastic resin, nor does it account for interprovincial trade in sorted and baled plastic or recycled plastic resin. Because of this, the geographic dimension of estimates for recycled plastic resin represents the province or territory where the plastic was discarded, not the location of the final processor producing the recycled pellets and flakes.
The PFAPM estimates only the mass of plastic in items, not the total mass of an item itself, nor other materials that make up the item. It does not, for example, include the mass of metal in vehicles, or the fraction of that metal that is recycled.
In the PFAPM, recycled resins are produced from plastic recovered from discarded products that enter waste management streams and are processed into pellets and flakes ready for use in the production of new products.
Items that may be re-used, such as vehicles or clothes, are accounted for in the net stock of plastic in products that remain in use at the end of each year. This variable is the difference between plastic in products produced for Canadian consumption and total discarded plastic in products. It accounts for products that are produced in the current year but will only be discarded in future years; products that were produced in previous years and are being discarded in the current year; and products that are being discarded by one user and re-used by another, without entering a waste management stream.
In addition to the data released for 2021, some estimates for 2020 have been revised to reflect updated data sources.
Reference
Data tables: 38-10-0150-01 and 38-10-0151-01.
- Note: some data tables may best be viewed on desktop.
Definitions, data sources and methods: survey number 5115.
Previous release: Physical flow account for plastic material, 2020.
Contact information
For more information, or to enquire about the concepts, methods or data quality of this release, contact us (toll-free 1-800-263-1136; 514-283-8300; infostats@statcan.gc.ca) or Media Relations (statcan.mediahotline-ligneinfomedias.statcan@statcan.gc.ca).