

The estimated gross domestic product (GDP) at market prices for underground economic activity in Canada was $72.4 billion in 2023, equivalent to 2.5% of total GDP.
The underground economy contracted 1.8% in real terms in 2023, following a 0.3% increase in 2022. The increase in 2022 was due to higher underground economic activity in household final consumption expenditure (+1.9%). Most of the decline in 2023 was the result of a decrease in underground economy construction activity in residential structures (-11.0%), as activity declined after increasing during the COVID-19 pandemic and post-pandemic periods.
The underground economy consists of market-based economic activities, whether legal or illegal, that escape measurement because of their hidden, illegal or informal nature. Some illegal activities related to drugs (except cannabis) and prostitution have been excluded due to the difficulty of obtaining reliable source data in these areas.
Exports and household final consumption expenditure lead underground economic growth in 2023
Underground economic activity related to household final consumption expenditure increased by 3.4% in 2023 to reach $40.8 billion, or 56.4% of the underground economy on an expenditure basis.
Exports in the underground economy, which are typically related to smuggling activities, rose 3.3% in 2023 to reach 14% of underground economic expenditure activity. This proportion, the highest since 2015, was reached in the context of border crossings continuing to normalize after the pandemic.
Food, beverages, tobacco and cannabis is the largest category for underground household expenditure
In 2023, just over one-quarter (25.3%) of total household final consumption expenditure related to underground economy activity was tied to household purchases of alcoholic beverages, tobacco and cannabis products defined as purchasing these products from an unlicensed or unregulated source. This share has been declining with the legalization of cannabis and lack of growth in this category. By comparison, about 3.5% of economy-wide household spending was on these products.
Spending on food, beverage and accommodation services (20.0%) and housing, water, electricity, gas and other fuels (20.9%), the majority of which are unreported rents, were other large contributors to underground economic activity.
Undeclared wages and tips account for largest share of unreported income
Almost half (45.2%), or $32.7 billion, of unreported income in 2023 went to employees in the form of labour compensation. This represented 2.2% of economy-wide compensation of employees, continuing the decline seen since 2021. The remaining portion of underground income went to incorporated business owners (29.2%) and unincorporated business owners (24.0%), such as unincorporated contractors working on residential construction.
Residential construction largest contributor to underground activity
In 2023, the residential construction industry accounted for 32.7% of all underground economic activity, making it the largest contributing industry, followed by finance, insurance, real estate, rental and leasing and holding companies (15.3%), retail trade (10.5%) and accommodation and food services (8.0%). These four industry groups accounted for two-thirds of all underground economic activity in Canada, and it has been the same mix of top contributing industries since 1992. Underground economic activity differs by industry, for residential construction it could be undeclared renovations and additions, for retail trade and accommodation and food services it would be undeclared sales (skimming).
Underground economy by province and territory
The total value of underground economic activity in 2023 was highest in the four largest economies: Ontario ($29.5 billion), Quebec ($15.0 billion), British Columbia ($11.7 billion) and Alberta ($7.6 billion). These four provinces accounted for 88.0% of total underground economy, while the total GDP created by these four provinces accounted for 87.3% of the total economy.
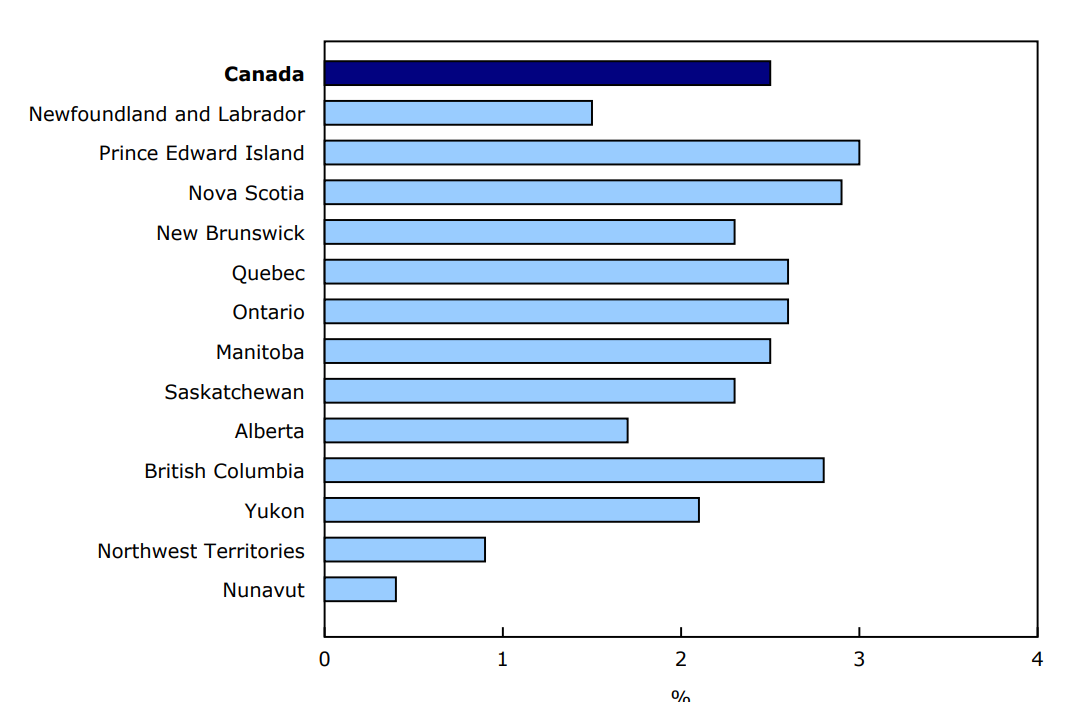
As a proportion of each province and territory's total economy GDP in 2023, the underground economic activity was the largest in Prince Edward Island (3.0%), Nova Scotia (2.9%) and British Columbia (2.8%), while Nunavut had the smallest share (0.4%). These proportions have all declined since 2021, as the total economy has outpaced growth in the underground economy during the pandemic recovery.
Chart 1: Underground economy as a proportion of gross domestic product by province and territory, 2023
Description - Chart 1
Data table: Underground economy as a proportion of gross domestic product by province and territory, 2023
Source: Table 36-10-0682-01.
Note to readers
Available today are new estimates of the underground economy by province and territory for 2022 to 2023. Updated estimates for reference years 2017 to 2021 are also available.
All estimates in this release are expressed in current dollars at market prices unless otherwise stated. The study provides estimates adjusted for inflation (real terms) at the national level but not by province or territory.
The study presents underground economy estimates based on the three methods of measuring gross domestic product (GDP): the expenditure-based approach, the income-based approach and the industry-based approach. Activities covered in this study include underreported or not reported activities such as skimming (not declaring sales or income), construction-related activity, hidden rent, undeclared tips and trade-related (smuggling), unlicensed operations such as the production and consumption of alcohol, tobacco and cannabis, and informal sector activities such as home-based childcare, private household services, other personal care services and other activities. More information on the methodology for the study can be found in the article The underground economy in Canada, sources and methods.
Readers should be careful in interpreting the results of this study. First, estimates presented give an upper bound, as recommended by the Organisation for Economic Co-operation and Development Handbook on Measuring the Non-observed Economy. To derive these bounds, assumptions were made to estimate the maximum potential underground activity beyond what is already included in GDP using standard methods.
Second, by its very nature, it is difficult to obtain information on the underground economy, so that the estimates necessarily rely on assumptions, indicative information and various indirect methods.
Third, official GDP already includes some implicit and explicit adjustments for underground activity. For these reasons, the estimates calculated in this study cannot simply be added to the official GDP to arrive at a measure of GDP including the underground economy.
The relative size of the underground economy in a province or territory often reflects the difference in economic structure in that province or territory. Provinces that have a higher concentration of industries that are more prone to underground activity, such as crop production, residential construction, and accommodation and food and beverage services will have a higher share of underground economic activity.
Reference
Data tables: Access the latest tables.
- Note: some data tables may best be viewed on desktop.
Definitions, data sources and methods: survey number 1901.
Previous release: The underground economy in Canada.
Contact information
For more information, or to enquire about the concepts, methods or data quality of this release, contact us (toll-free 1-800-263-1136; 514-283-8300; infostats@statcan.gc.ca) or Media Relations (statcan.mediahotline-ligneinfomedias.statcan@statcan.gc.ca).