

Canadian general government deficit rises
In the fourth quarter, the Canadian general government posted a deficit of $17.2 billion, an increase of $8.8 billion compared to the fourth quarter of 2023. Excluding social security funds, the deficit stood at $20.1 billion, up $10.4 billion from the fourth quarter of 2023.
The federal government deficit increased by $0.5 billion from the fourth quarter of 2023 to $8.9 billion in the fourth quarter of 2024, while the total deficit of provincial, territorial, and local governments increased by $10.0 billion to $11.3 billion.
As a percentage of nominal gross domestic product (GDP), the Canadian general government deficit was 2.2% in the fourth quarter of 2024, compared to 1.1% in the last quarter of 2023. The federal government recorded a deficit of 1.1% of GDP in the fourth quarter of 2024, a level similar to the fourth quarter of 2023. Provincial, territorial, and local governments reported having a deficit equivalent to 1.4% of GDP in the fourth quarter of 2024, while they had recorded a 0.2% deficit in the same quarter the previous year.
Chart 1: Canadian general government deficit as a percentage of nominal gross domestic product
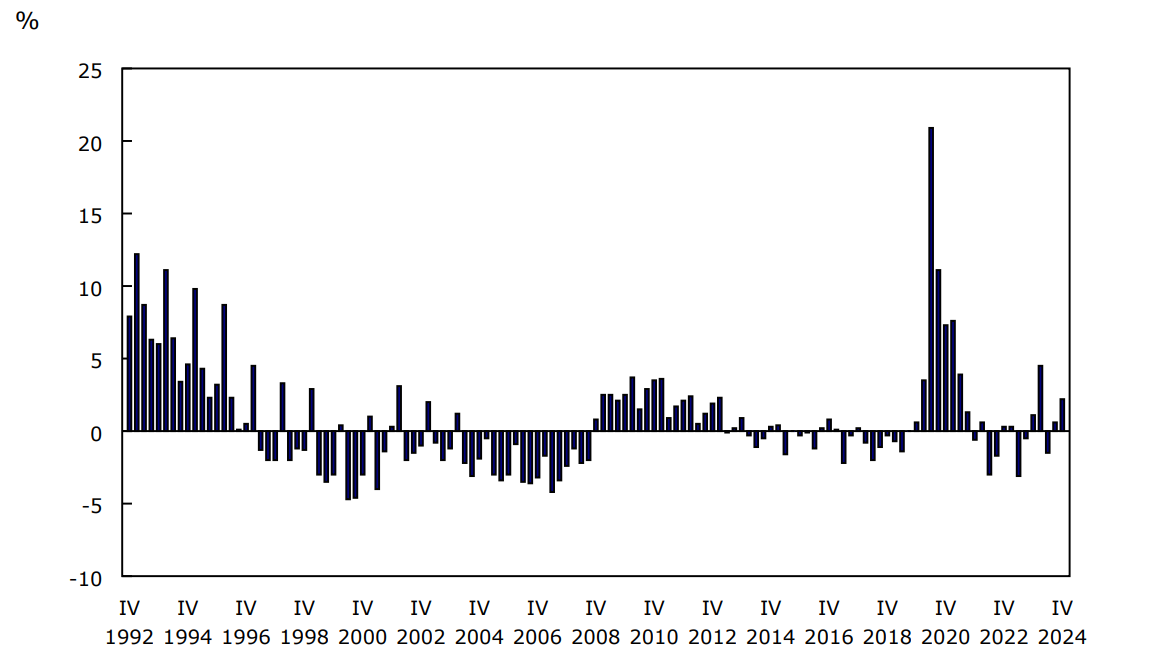
Description - Chart 1
Data table: Canadian general government deficit as a percentage of nominal gross domestic product
Sources: Tables 10-10-0015-01 and 36-10-0104-01.
Strong spending growth in 2024
After two consecutive years of surpluses, the Canadian general government fell back into a deficit in 2024. Over the four quarters of 2024, the increase in expenses (+$127.4 billion; +10.4%) far outpaced the increase in revenue (+$69.1 billion; +5.6%) resulting in a deficit of $42.9 billion. Most of the increase in expenses is attributable to the federal government.
For the four quarters of 2024, the federal government recorded a deficit of $65.2 billion, as increased revenues (+$28.8 billion; +6.1%) were not sufficient to cover increased expenses (+$80.4 billion; +16.7%).
The increase in federal government spending in 2024 was mainly due to the increase in transfers, including $28.3 billion for final settlement agreements for First Nations, as well as an additional $16.0 billion in grants allocated to general government units. Federal government social benefit expenses were up by $16.7 billion (+10.8%), led by Old Age Security (+$4.9 billion; +6.5%), Employment Insurance (+$3.5 billion; +18.2%) and the Canada Childcare Benefit (+$2.3 billion; +9.0%).
Despite the decline in interest rates in 2024, federal government interest expenses increased by $8.9 billion (+21.2%) due to a higher debt level. Growth in interest expenses in 2024 was more moderate than the increase observed in 2023 (+$11.3 billion; +36.8%).
Chart 2: Components of federal government expenses (sum of four quarters)
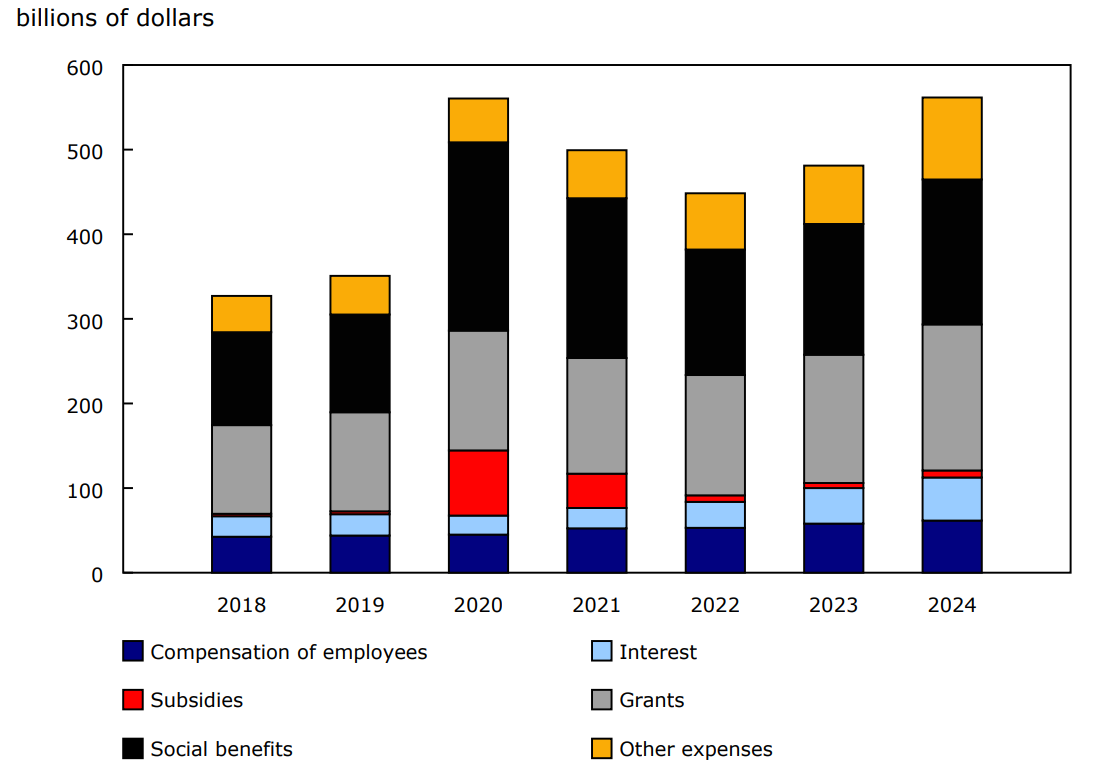
Description - Chart 2
Data table: Components of federal government expenses (sum of four quarters)
Notes: Other expenses include: Use of goods and services, consumption of fixed capital, and other expense.
Source: Table 10-10-0015-01.
Growth in financial assets of social security funds reduces Canadian general government net debt
Canadian general government net debt decreased to $568.0 billion in the fourth quarter of 2024, a reduction of $66.5 billion from the fourth quarter of 2023. Excluding social security funds, which assets are earmarked to pay future benefits, net debt increased by $61.0 billion (+4.5%) to $1,418.4 billion at the end of the fourth quarter of 2024.
Meanwhile, federal government net debt reached $953.9 billion at the end of the fourth quarter, up $48.0 billion from the same period of 2023. The increase in financial assets (+$45.0 billion) was outpaced by the increase in liabilities (+$93.0 billion), primarily due to an increase in outstanding debt securities such as bills and bonds.
As a percentage of GDP, Canadian general government net debt stood at 18.5% at the end of the fourth quarter of 2024, a decrease from 21.6% in the same period of 2023. Excluding social security funds, the ratio of net debt-to-GDP slightly changed to 46.2% at the end of the fourth quarter of 2024 from 46.3% in the same period of 2023. The ratio of net debt-to-GDP of the federal government was 31.1% at the end of the fourth quarter of 2024, while that of provincial, territorial and local governments stood at 15.1%.
Chart 3: Net debt as a percentage of nominal gross domestic product by government subsector

Description - Chart 3
Data table: Net debt as a percentage of nominal gross domestic product by government subsector
Sources: Tables 10-10-0015-01 and 36-10-0104-01.
Focus on Canada and the United States
In the fourth quarter of 2024, taxes on international trade and transactions totalled $1.5 billion and represented 1.2% of total federal government revenue. These taxes consist primarily of customs duties on certain goods entering the country or on services delivered by non-residents to Canadian residents.
In the coming quarters, these revenues are expected to increase with the imposition of retaliatory tariffs on products imported from the United States, as well as a surtax on imports of steel and aluminum products from China, introduced by the federal government in October 2024.
For more data and insights on areas touched by the socio-economic relationship between Canada and the United States, see the Focus on Canada and the United States webpage.
Note to readers
Quarterly financial data for the Canadian general government and its subsectors from the first quarter of 1990 to the fourth quarter of 2024 are now available. These subsectors include the federal government, provincial and territorial governments, local governments and the Canada Pension Plan and the Québec Pension Plan.
Government Finance Statistics (GFS) present fiscal statistics using the standard developed by the International Monetary Fund. This standard allows consistent aggregation and analysis between participating countries.
In GFS standards, the net operating balance is the difference between revenues and expenses for a given period and is a summary measure of the sustainability of government operations. When revenues are lower than expenses, a deficit is recorded, while the reverse induces a surplus.
The net financial worth is the difference between financial assets and liabilities at market prices for a given period and is a key indicator to assess the sustainability of fiscal policy. This measure is equivalent to the reverse value of net debt, a measure commonly used in the government's financial statements.
Currently, GFS quarterly data are derived by mapping Canada's System of National Accounts data to GFS standards and conventions.
This release of GFS includes revised data from the first quarter of 2024 to the third quarter of 2024.
Reference
Data table: 10-10-0015-01.
- Note: some data tables may best be viewed on desktop.
Definitions, data sources and methods: survey number 5174
Previous release: Government finance statistics, third quarter 2024.
Next release: June 27, 2025.
Contact information
For more information, or to enquire about the concepts, methods or data quality of this release, contact us (toll-free 1-800-263-1136; 514-283-8300; infostats@statcan.gc.ca) or Media Relations (statcan.mediahotline-ligneinfomedias.statcan@statcan.gc.ca).