
Canada is a vast country supporting a diversity of landscapes. Treed areas, including those that had been disturbed by fire or harvest, were the main land cover type in 2020, covering 36.9% of the inland area of Canada. This was followed by grassland and shrubland (19.1%), non-treed wetlands (12.7%) and inland water bodies (12.6%).
Map 1: Treed area disturbance occurring from 1990 to 2020 as percentage of total treed area, by ecoprovince
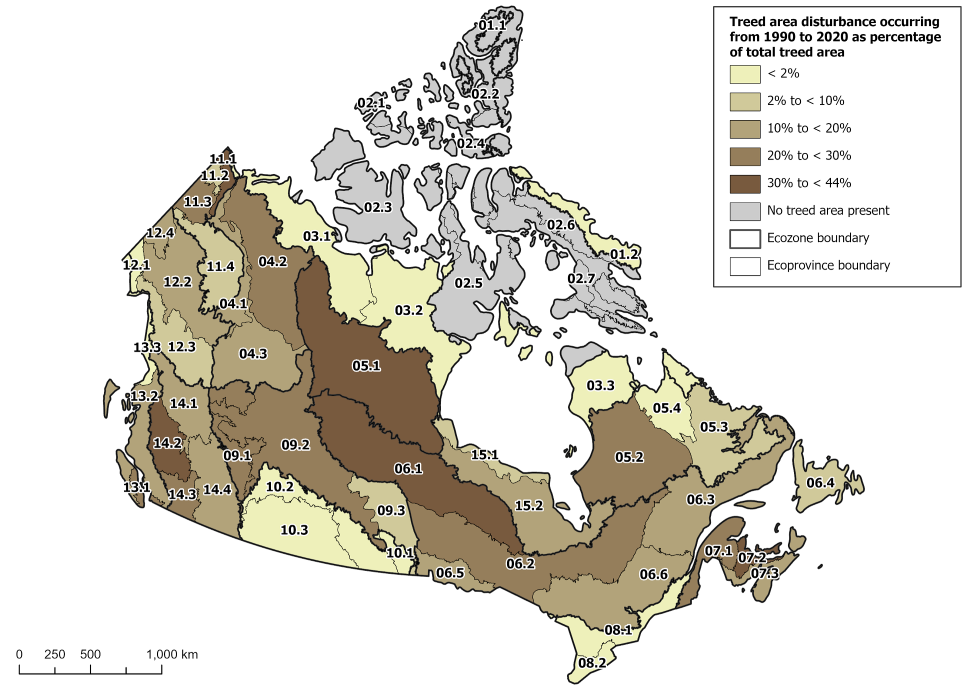
Description - Map 1
The title of the map is "Treed area disturbance occurring from 1990 to 2020 as percentage of total treed area, by ecoprovince"
This map provides a visual representation of the treed area that experienced disturbance in the form of fire or harvest from 1990 to 2020 as a percentage of the total treed area.
The figure is a map of Canada, with ecoprovince boundaries represented by thin grey lines and ecozone boundaries represented by thick black lines. There is a legend in the top right corner and a scale bar in the bottom left corner. Ecoprovinces are labelled.
The 53 ecoprovinces of Canada are categorized in one of five classes, according to the percentage of treed area disturbance. Treed area disturbance is highest in a wide swath of the country from the Atlantic provinces in the southeast to British Columbia and Yukon in the west. The Western Taiga Shield, Western Boreal Shield, Northern Yukon Mountains and Central Montane Cordillera ecoprovinces have the highest percentages. Northern Canada, the Prairie ecoprovinces and southwest Ontario and Quebec have the lowest percentage of treed area disturbance over the period from 1990 to 2020.
Legend: Ecoprovinces are represented using a colour gradient from pale yellow to dark brown. The shading intensity varies, with pale yellow representing ecoprovinces where less than 2% of the total treed area has experienced disturbance and dark brown representing those that have experienced 30% to 44% disturbance. Ecoprovinces with no treed area are shown in grey.
Notes: Total treed area includes both treed area and treed area that had been disturbed by fire or harvest from 1990 to 2020. Ecoprovinces are labelled. Ecoprovinces are subdivisions of ecozones and are identified with a unique numeric code. The first two digits of the ecoprovince code indicate the ecozone.
Source: Environment Accounts and Statistics Division.
Fire and harvesting affected one-fifth of Canada's treed areas from 1990 to 2020
Collectively, treed areas, including those that had been disturbed, covered close to 3.68 million km2 in 2020, or over one-third of the inland area of Canada. Of this total, 725,223 km2 of treed areas were in various stages of regeneration after having experienced disturbance from forest fires or harvesting during the period from 1990 to 2020. All told, 39.3% of treed area disturbance occurred in the Boreal Shield, the largest ecozone in Canada, which spans across portions of six provinces, from Newfoundland and Labrador to Alberta.
Less than 1% of Canada's inland area was built-up in 2020
Built-up areas, including roads, buildings and associated vegetated areas, are the most highly modified landscapes in the country. Less than 1%, or roughly 68,000 km2, of Canada's inland area was built-up in 2020. The vast majority (97.6%) of this built-up area occurred in the seven southernmost ecozones, where 99.5% of the population lived in 2021. The Mixedwood Plains, home to 52.4% of the population in 2021, had the highest proportion of built-up area of all ecozones in 2020, at 9.5%.
Map 2: Non-treed wetland as percentage of total area, by ecoprovince, 2020
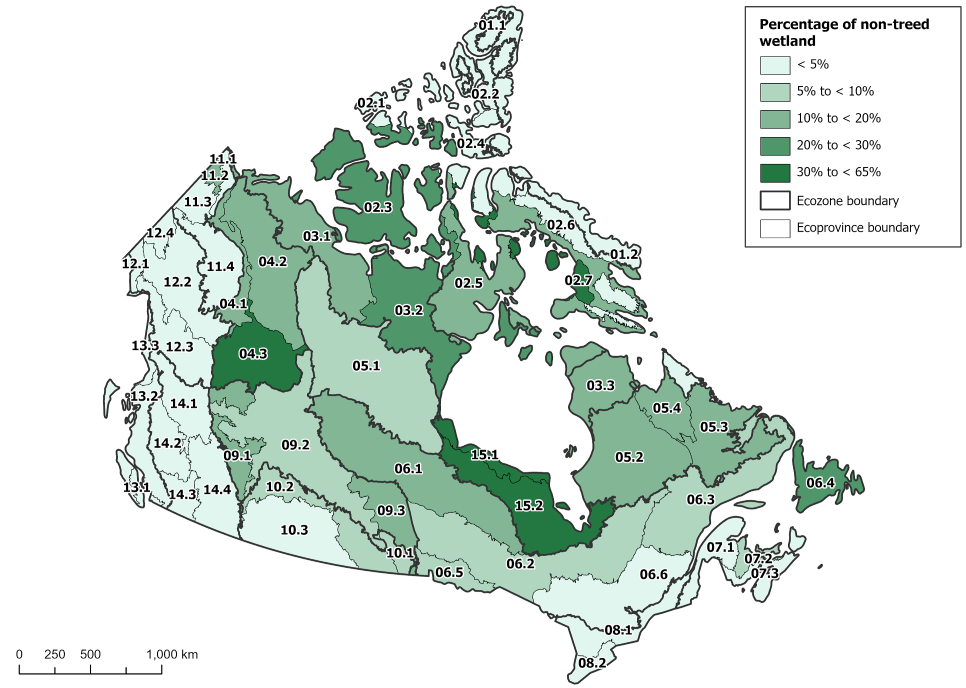
Description - Map 2
The title of the map is "Non-treed wetland as percentage of total area, by ecoprovince, 2020"
This map provides a visual representation of the proportion of non-treed wetlands in each ecoprovince.
The figure is a map of Canada, with ecoprovince boundaries represented by thin grey lines and ecozone boundaries represented by thick black lines. There is a legend in the top right corner and a scale bar in the bottom left corner. Ecoprovinces are labelled.
The 53 ecoprovinces of Canada are categorized in one of five classes, according to the percentage of non-treed wetland. The Hudson Bay Coastal Plains, Hudson-James Lowlands and Hay-Slave Lowlands have the highest percentage of non-treed wetlands. Meanwhile, ecoprovinces located along the west coast, in the Maritime provinces, southwestern Ontario and Quebec, and the High Arctic have less than 5% of their area as non-treed wetlands.
Legend: Ecoprovinces are represented using a colour gradient from pale green to dark green. The shading intensity varies, with pale green representing ecoprovinces where less than 5% of the total ecoprovince area is non-treed wetland and dark green representing ecoprovinces with 30% to 64% of the area as non-treed wetland.
Notes: Ecoprovinces are labelled. Ecoprovinces are subdivisions of ecozones and are identified with a unique numeric code. The first two digits of the ecoprovince code indicate the ecozone.
Source: Environment Accounts and Statistics Division.
Non-treed wetlands covered 12.7% of Canada's inland area in 2020
Wetlands provide a wealth of ecosystem services, such as purifying and regulating water, storing carbon and supporting recreational activities. In 2020, 12.7% of Canada's inland area was covered by non-treed wetlands, representing about 1.27 million km2, comparable with the land area of the province of Quebec. This figure does not include treed wetlands, which are included in the treed area class and cover large areas, particularly in the Boreal Shield, Boreal Plains and Hudson Plains ecozones.
Cropland covered 60% of the Prairie ecozone in 2020
In 2020, 4.3%, or 427,540 km2, of Canada's inland area consisted of cropland. This land produced nearly 150 000 kilotonnes of agricultural provisioning services, such as crops, silage, fruits and vegetables. In total, 95.1% of this land cover type occurred in three ecozones: the Prairie (64.6%), Boreal Plains (19.4%) and Mixedwood Plains (11.1%) ecozones. Of all ecozones, the Prairie ecozone had the highest proportion of land area as cropland (59.5%).
Permanent snow and ice covered 1.8% of Canada in 2020
Grassland and shrubland covered almost one-fifth of the inland area of the country in 2020. They were found in many areas of the country, but particularly in the taiga and tundra regions of Northern Canada. Sparsely vegetated and barren lands, which collectively covered nearly 1.2 million km2, or 11.9% of Canada's inland area, were most abundant in the three northernmost ecozones of the Arctic Cordillera, Northern Arctic and Southern Arctic.
In 2020, just over 178,000 km2 of Canada's land was covered by year-round snow and ice, a value that will be closely examined over the coming years given the changing climate. About half (49.8%) of the Arctic Cordillera ecozone was covered with this land cover type.
Note to readers
Statistics Canada's Census of Environment program reports on ecosystems in Canada, providing information to help Canadians make evidence-based decisions to protect and enhance the environment. The program follows the internationally accepted environmental-economic standard for producing information on ecosystems' extent, their condition and the services they provide.
The land cover 2020 data release includes two complementary product types that provide information on the extent of terrestrial and freshwater land cover classes.
Land cover area estimates by ecoprovince, sub-drainage area and drainage region are available in tables 38-10-0177-01 and 38-10-0178-01.
The Land cover register, a spatially explicit representation of Canada's land cover classes at 30-metre resolution, is available as a geospatial file in Census of Environment: Spatial information products. Data product specifications are available upon request.
The Land cover register was created through the integration of multiple land cover and land use datasets and includes 11 land cover classes: built-up and artificial surface, cropland, inland water body, treed (non-wetland), treed wetland, treed area disturbance, grassland and shrubland, wetland (non-treed), sparsely vegetated land, barren land, and permanent snow and ice.
Land cover area estimates and uncertainty measures were generated using a design-based estimation procedure. The land cover register was used as the base map for stratified sampling and a reference dataset was generated through the interpretation of high-resolution Earth observation imagery. The treed (non-wetland) and treed wetland classes were combined into a single "treed" class due to challenges in manual photointerpretation.
For more information, see "Canadian System of Environmental-Economic Accounting – Ecosystem Accounts."
Reference
Data tables: 38-10-0177-01 and 38-10-0178-01.
- Note: some data tables may best be viewed on desktop.
Definitions, data sources and methods: survey number 5331.
Contact information
For more information, or to enquire about the concepts, methods or data quality of this release, contact us (toll-free 1-800-263-1136; 514-283-8300; infostats@statcan.gc.ca) or Media Relations (statcan.mediahotline-ligneinfomedias.statcan@statcan.gc.ca).