

Highlights
In January, major Canadian airlines flew 6.9 million passengers on scheduled and charter services, while capacity reached 23.5 billion available seat-kilometres.
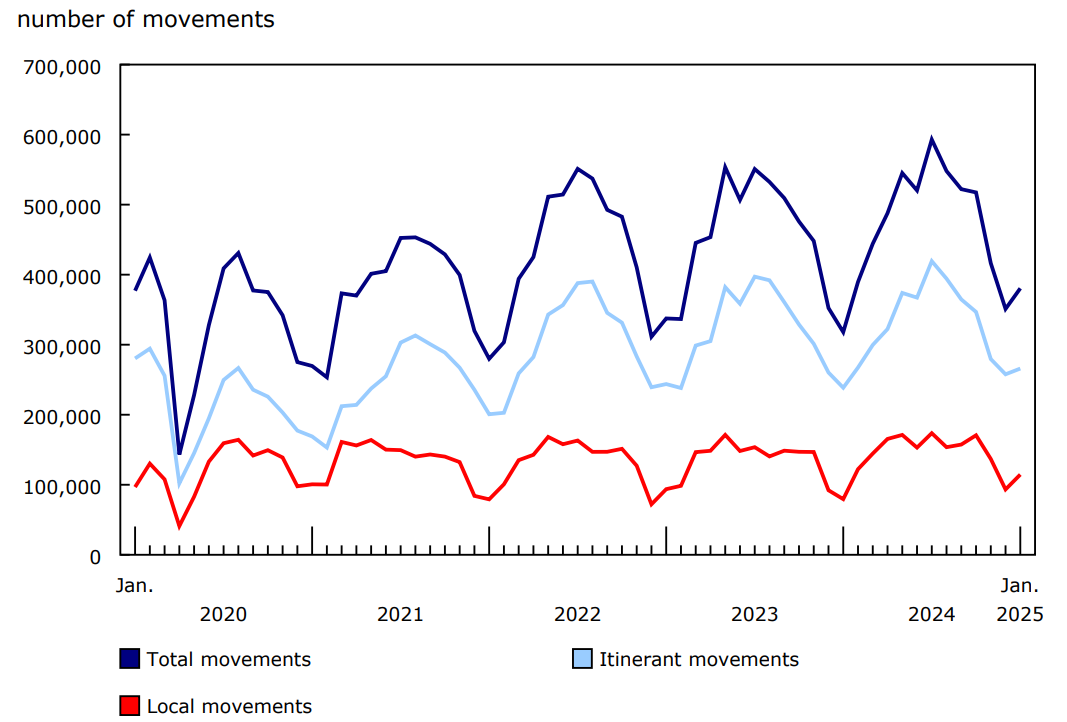
Canada's major and select small airports recorded a total of 380,486 aircraft movements in January, up 19.6% from January 2024. Local movements jumped 44.2% year over year to 114,564 in January 2025, while itinerant movements rose 11.5% to 265,922.
Consult the Aviation Data Visualization Hub to explore aircraft movement statistics and monthly civil aviation statistics in an interactive format.
Major airlines' capacity increases more than demand
The seven Canadian Level I air carriers flew 6.9 million passengers on scheduled and charter services in January, compared with 6.8 million in the same month of 2024.
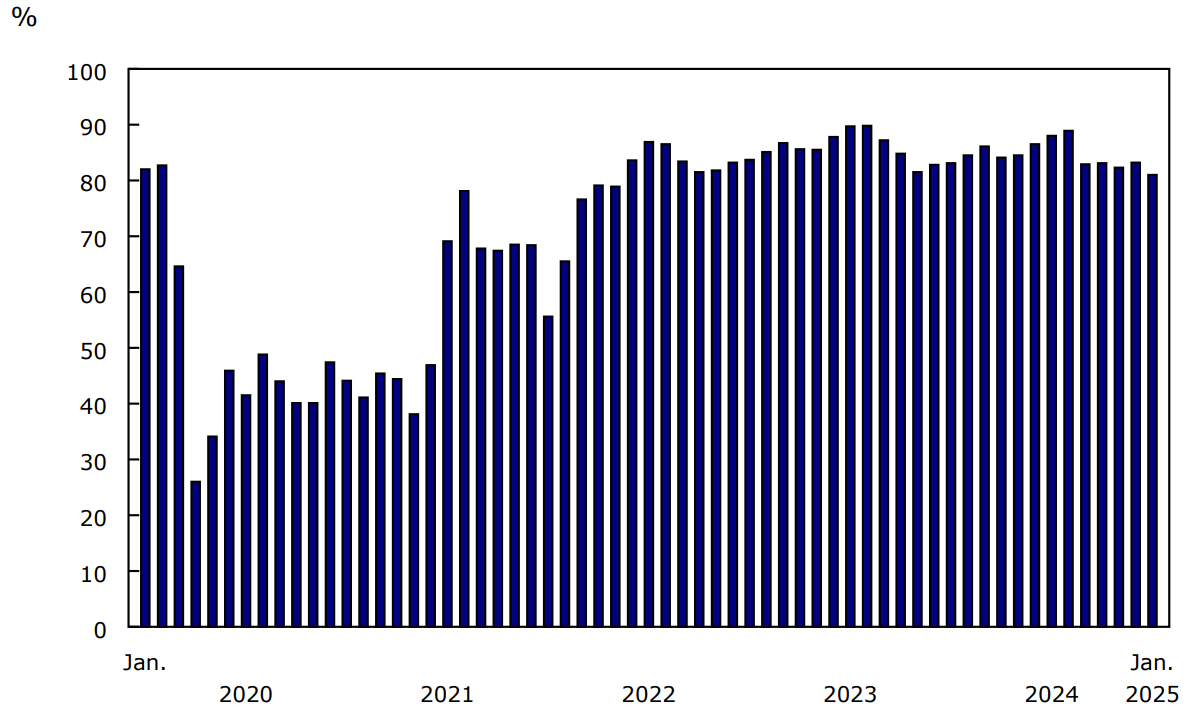
The number of passenger-kilometres in January 2025 was 19.0 billion, a 2.2% increase from January 2024, while capacity reached 23.5 billion available seat-kilometres, up 4.9%. As a result, the passenger load factor (the ratio of passenger-kilometres to available seat-kilometres) was 81.0% in January 2025, down from 83.1% in the same month one year earlier. This was the lowest load factor since May 2022, when the industry was recovering from the COVID-19 pandemic.
Chart 1: Passenger load factor, Canadian air carriers, Level I
Description - Chart 1
Data table: Passenger load factor, Canadian air carriers, Level I
Source: Table 23-10-0079-01.
Level I carriers flew 191,000 hours (+3.8%) in January 2025 and generated $2.4 billion (+3.3%) in total operating revenue.
Increased local and domestic aircraft movements
At Canada's major and select small airports, local aircraft movements, which can be weather dependent, rose by 44.2% in January as compared with the same month in 2024, when a 15.2% year-over-year decline was recorded. In January 2024, severe winter storms impacted aircraft movements at several airports in the Lower Mainland of British Columbia, while in January 2025, weather conditions were among the driest on record, allowing for increased flight school activity.
Chart 2: Total aircraft movements at major and select small airports, by class of operation
Description - Chart 2
Data table: Total aircraft movements at major and select small airports, by class of operation
Source: Table 23-10-0296-01.
Notably, local movements at Boundary Bay (12,088 movements) in January 2025 were the highest recorded at the airport for the month of January. At Saskatoon/John G. Diefenbaker International, local traffic activity more than doubled (+137.4%) year over year in January to reach 4,236. In contrast, there were 65.6% fewer local movements at Fredericton International—the fourth consecutive month of decline following the gradual suspension of operations at a flight school.
At the same time, itinerant domestic movements rose 14.2% year over year to 214,512 in January, driven by other commercial operations including flight school activity.
Following two consecutive months of year-over-year declines, transborder movements (to and from the United States) in January edged up 0.8% from the previous year to 32,401. Other international traffic (outside the United States) rose 1.9% to 19,009.
Focus on Canada and the United States
Transborder aircraft movements (to and from the United States) represented 10.7% of total itinerant movements at Canada's major and select small airports in 2023 and 11.1% in 2024. The four largest Canadian airports—Toronto/Lester B. Pearson International, Montréal/Pierre Elliot Trudeau International, Vancouver International, and Calgary International—have accounted for approximately 75% of all transborder traffic each year since 2022.
For more data and insights on areas touched by the socio-economic relationship between Canada and the United States, see the Focus on Canada and the United States webpage.
Note to readers
This consolidated monthly release covers the following survey programs:
- Aircraft movement statistics (survey number 2715, tables 23-10-0296-01 to 23-10-0304-01)
- Monthly civil aviation statistics (survey number 5026, table 23-10-0079-01).
Consult the Aviation Data Visualization Hub to explore data from Aircraft movement statistics and Monthly civil aviation statistics in an interactive format.
The aviation statistics program uses respondent (Monthly civil aviation statistics) and administrative (Aircraft movement statistics) data.
An aircraft movement is defined as a take-off, landing or simulated approach by an aircraft, as defined by NAV CANADA.
An itinerant movement is the initial take-off or the final landing of an aircraft.
A local movement is an aircraft conducting the following airport activities: touch-and-go, stop-and-go, simulated approach without landing, low approach, pull up while on final approach or missed approach. Local movements are often carried out during training flights (touch-and-go), equipment tests, etc.
On July 11, 2024, the flight service station at Peace River, British Columbia, was officially closed. Starting in August 2024, movements for Peace River Airport are excluded from Aircraft movement statistics. Data prior to August 2024 will continue to be available.
The Monthly Civil Aviation Survey covers all Canadian Level I air carriers: Air Canada (including Air Canada Rouge), Air Transat, Flair, Jazz, Porter, Sunwing and WestJet (including WestJet Encore and WestJet Link).
The average passenger trip length is calculated by dividing the number of passenger-kilometres by the number of passengers. Trips across Canada and around the world are included in this calculation.
The data in this monthly release are not seasonally adjusted.
Data are subject to revisions.
Reference
Data table / Data tables: Access the latest tables.
- Note: some data tables may best be viewed on desktop.
Definitions, data sources and methods: survey numbers 2715 and 5026.
Previous release: Aircraft movement and civil aviation statistics, December 2024.
Contact information
For more information, or to enquire about the concepts, methods or data quality of this release, contact us (toll-free 1-800-263-1136; 514-283-8300; infostats@statcan.gc.ca) or Media Relations (statcan.mediahotline-ligneinfomedias.statcan@statcan.gc.ca).