

Highlights
In January, the volume of cargo carried by Canadian railways reached 32.1 million tonnes, up 8.0% from January 2024. Year-over-year gains in carloadings of wheat, coal and canola in January 2025 contributed to the overall increase.
The overall freight volume in January was above the five-year average of 30.3 million tonnes for the month.
To further explore the latest data and historical trends in an interactive format, please visit the "Monthly Railway Carloadings: Interactive Dashboard."
Chart 1: Railway carloadings, total tonnage
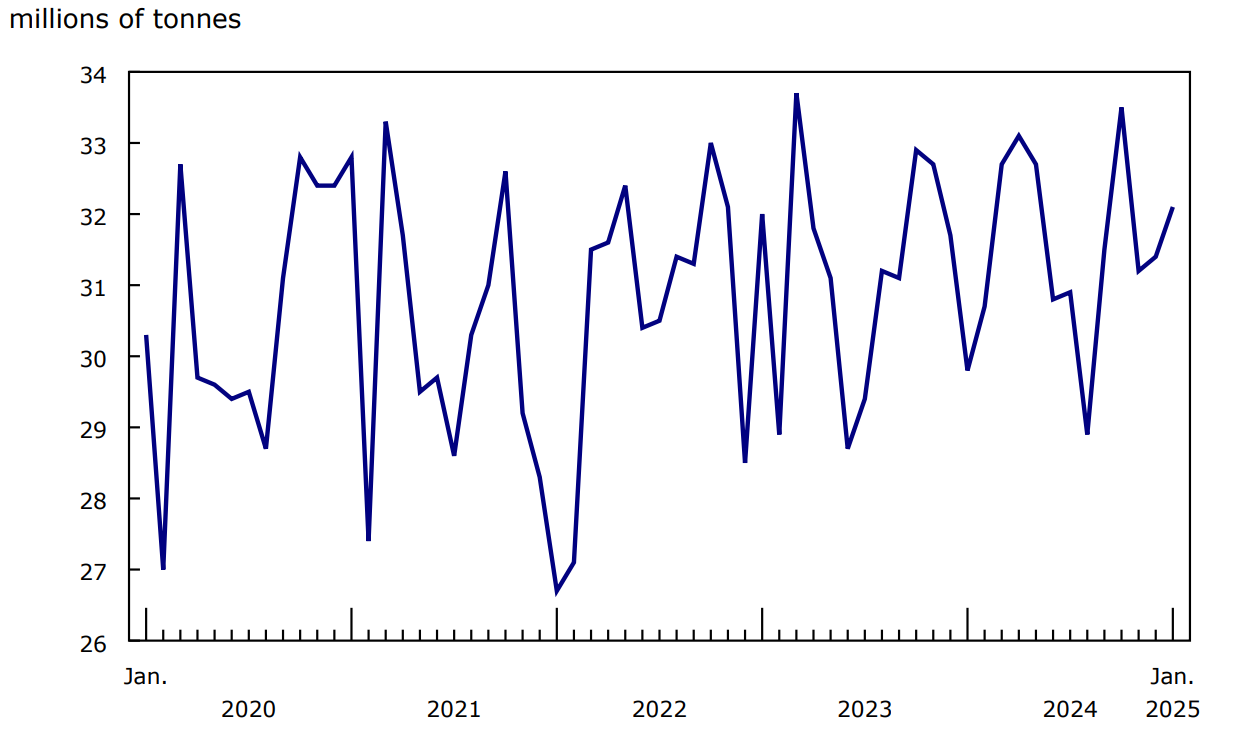
Description - Chart 1
Data table: Railway carloadings, total tonnage
Source: Table 23-10-0216-01.
The increase in total freight carried in January was due to higher volumes across all types of rail operations: non-intermodal loadings (mainly commodities), intermodal loadings (mainly containers) and freight traffic from connections with American railways.
Carloadings of wheat, coal and canola lead growth
In January, domestic non-intermodal freight traffic was up 7.5% year over year to 25.5 million tonnes. There were gains in the loadings of several commodities during the month.
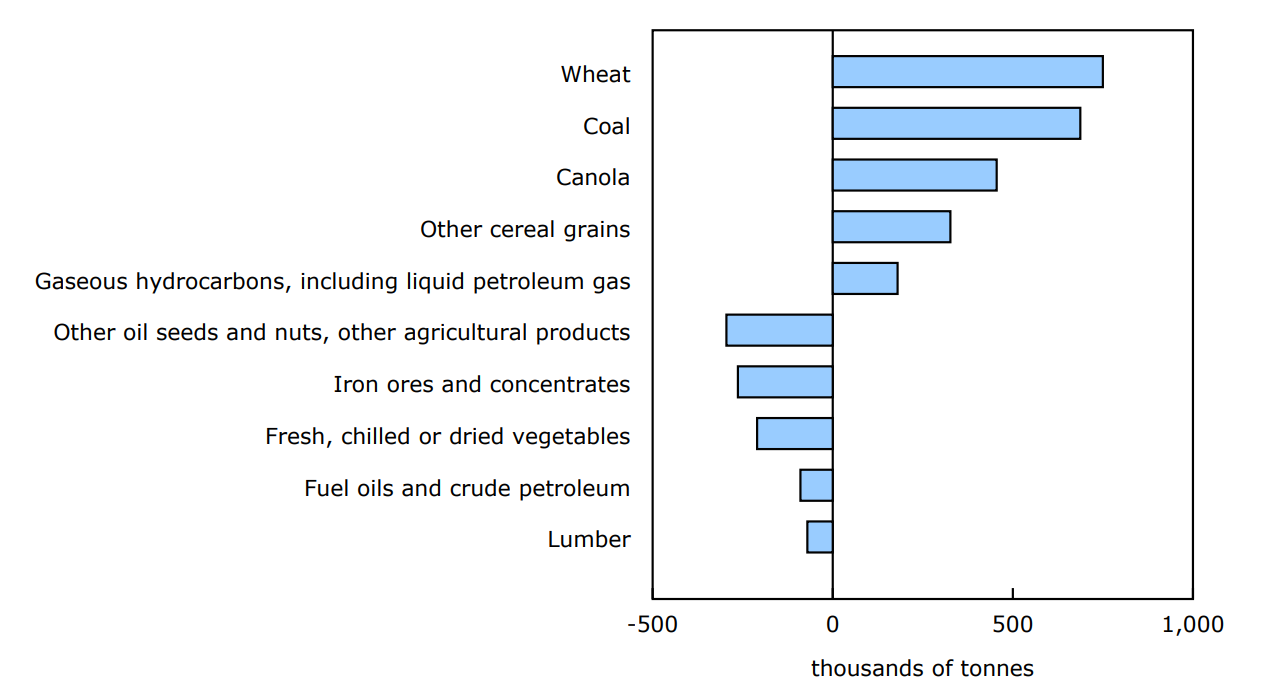
The largest increase was recorded in wheat, with loadings rising by 43.1% (+750 000 tonnes) in January compared with the same month in 2024. Meanwhile, loadings of canola posted a year-over-year increase for the 10th consecutive month, rising sharply by 103.9% (+455 000 tonnes) in January 2025.
Loadings of coal also posted a gain in January, rising 25.7% (+687 000 tonnes) year over year.
Chart 2: Railway carloadings, largest commodity differences, January 2024 to January 2025
Description - Chart 2
Data table: Railway carloadings, largest commodity differences, January 2024 to January 2025
Source: Table 23-10-0216-01.
Some commodities down
The increases in non-intermodal loadings in January were partly offset by declines in other commodities. Loadings of other oil seeds and nuts and other agricultural products dropped 61.9% (-295 000 tonnes) in January 2025 compared with the same month in 2024.
Loadings of iron ores and concentrates decreased 5.4% (-263 000 tonnes) in January 2025 compared with January 2024, while loadings of fresh, chilled or dried vegetables were down 47.2% (-210 000 tonnes).
Intermodal traffic up
In January 2025, intermodal shipments—mainly containers—originating in Canada were up 12.5% year over year to 3.1 million tonnes.
American freight trending up
In January, freight traffic from US rail connections increased year over year by 7.8% (+259 000 tonnes) to reach 3.6 million tonnes. This was the highest volume recorded for the month of January since 2022.
Focus on Canada and the United States
While tariffs affect many facets of an economy, the most direct is international merchandise trade. The United States is Canada's most important trading partner.
Many of Canada's exports to the United States are sent by rail. In January 2025, about two-thirds of Canada's exports of wheat to the United States were sent by rail, while virtually all (96.9%) potash exports were transported by rail, as reported in the table Canadian international merchandise trade by mode of transport.
Railway carloadings received from US connections represented on average 12.0% of total tonnage carried by rail during 2024 and 11.2% of the total in January 2025. Statistics Canada will continue to monitor potential impacts of tariffs on railway carloading statistics.
For more data and insights on areas touched by the socio-economic relationship between Canada and the United States, see the Focus on Canada and the United States webpage.
Note to readers
The Monthly Railway Carloadings Survey collects data on the number of rail cars, tonnage, units and 20-feet equivalent units from railway transporters operating in Canada that provide for-hire freight services.
Cargo loadings from Armstrong, Ontario, to the Atlantic Coast are classified to the eastern division (Eastern Canada), while loadings from Thunder Bay, Ontario, to the Pacific Coast are classified to the western division (Western Canada).
Survey data are revised on a monthly basis to reflect new information.
The data in this release are not seasonally adjusted.
The Transportation Data and Information Hub, featuring data from Statistics Canada, Transport Canada and partners, provides Canadians with online access to comprehensive statistics and indicators for the country's transportation sector.
Reference
Data tables: 23-10-0216-01.
- Note: some data tables may best be viewed on desktop.
Definitions, data sources and methods: survey number 2732.
Previous release: Railway carloadings, December 2024.
Contact information
For more information, or to enquire about the concepts, methods or data quality of this release, contact us (toll-free 1-800-263-1136; 514-283-8300; infostats@statcan.gc.ca) or Media Relations (statcan.mediahotline-ligneinfomedias.statcan@statcan.gc.ca).