
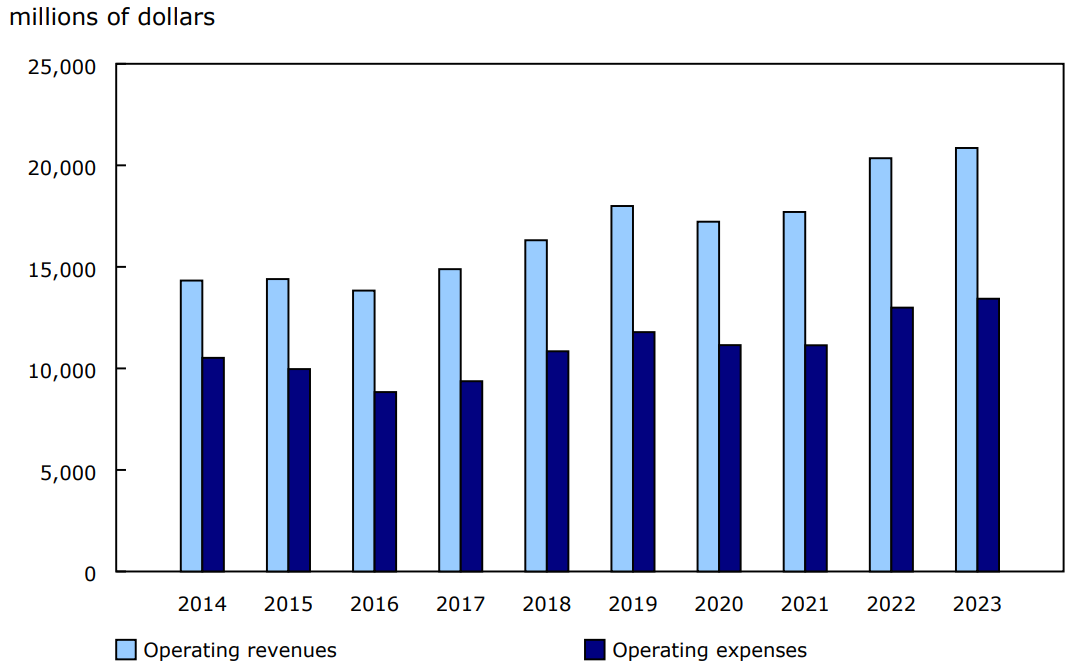
In 2023, operating revenues for the Canadian rail transportation industry rose 2.5% year over year to reach $20.9 billion. This marks the third consecutive year of growth. Inflationary pressures as well as a higher volume of goods transported during the year largely contributed to this increase.
The Canadian rail transportation industry is comprised of two mainline freight carriers, several shortline freight railways and passenger rail companies.
Freight revenues strong
Despite wildfires in June 2023 and labour disruptions at Canada's West Coast ports in July, freight revenues increased 3.2% from 2022 to $18.8 billion. In 2023, freight revenues accounted for 90.1% of the rail industry's total operating revenues.
Freight revenues for the shortline carriers—which made up 7.3% of the industry's total freight revenues in 2023—increased 9.1% compared with 2022. Shortline carriers often transport specific commodities, such as agricultural or metal products, connecting producing areas with a mainline carrier.
Passenger revenues up sharply
Passenger revenues increased 27.4% year over year to $439.9 million in 2023, surpassing pre-COVID-19 pandemic levels ($420.1 million in 2019) for the first time. VIA Rail reported carrying 4.1 million passengers in 2023, which was 815,000 more passengers (+24.7%) compared with one year earlier.
Expenses also rise
Total rail operating expenses rose 3.4% (+$438.2 million) year over year to $13.4 billion in 2023, marking the second consecutive year-over-year increase. Most categories of operating expenses were up from the previous year, inclgeneral expenses (+10.3%), equipment expenses (+7.1%) and ways and structures expenses (+6.2%).
According to the Freight Rail Services Price Index, the cost of general freight rail services in Canada increased by 14.5% from the start of 2022 to the end of 2023.
However, lower global oil prices in 2023 led to a 12.0% decrease in fuel expenditures by Canadian railways, which fell from $2.9 billion in 2022 to $2.6 billion in 2023.
Despite the rise in overall expenditures, the industry's operating ratio (that is, operating expenses expressed as a proportion of operating revenue) held steady at 0.64 in 2023. In other words, Canadian railways spent $64 to generate $100 in revenue in 2023, the same as in 2022.
Chart 1: Rail operating revenues and expenses, 2014 to 2023
Description - Chart 1
Data table: Rail operating revenues and expenses, 2014 to 2023
Sources: Calculations are based on data from tables 23-10-0045-01 and 23-10-0046-01.
Highest level of freight volume since 2019
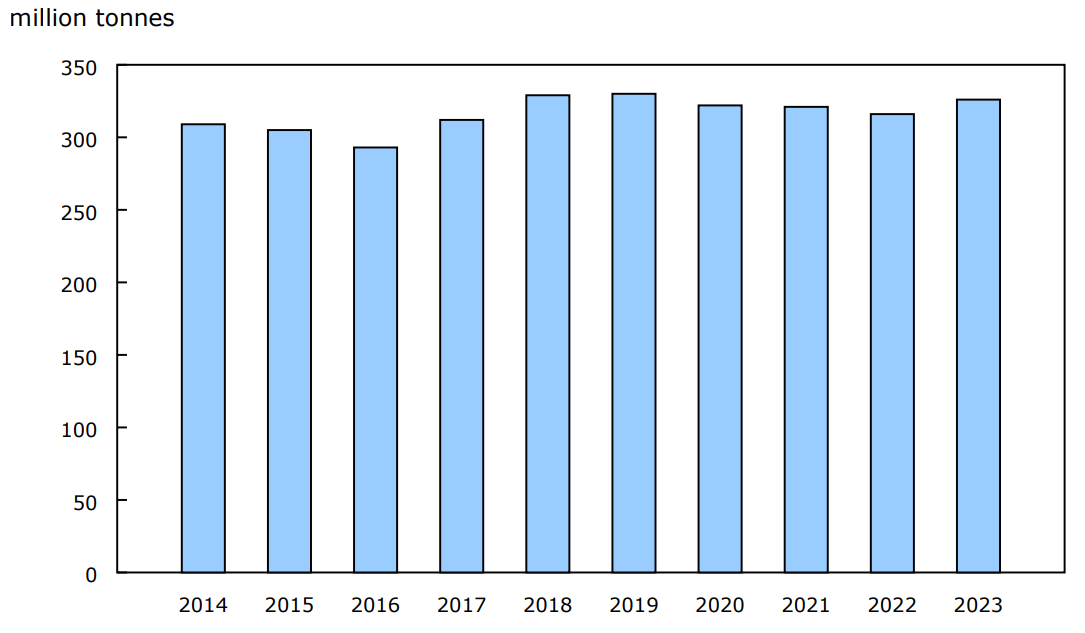
Total freight tonnage rose 3.1% year over year to 325.6 million tonnes in 2023. This marks the highest level of freight volume since 2019 (330.2 million tonnes).
Chart 2: Total freight volume transported by rail, 2014 to 2023
Description - Chart 2
Data table: Total freight volume transported by rail, 2014 to 2023
Source: Table 23-10-0062-01.
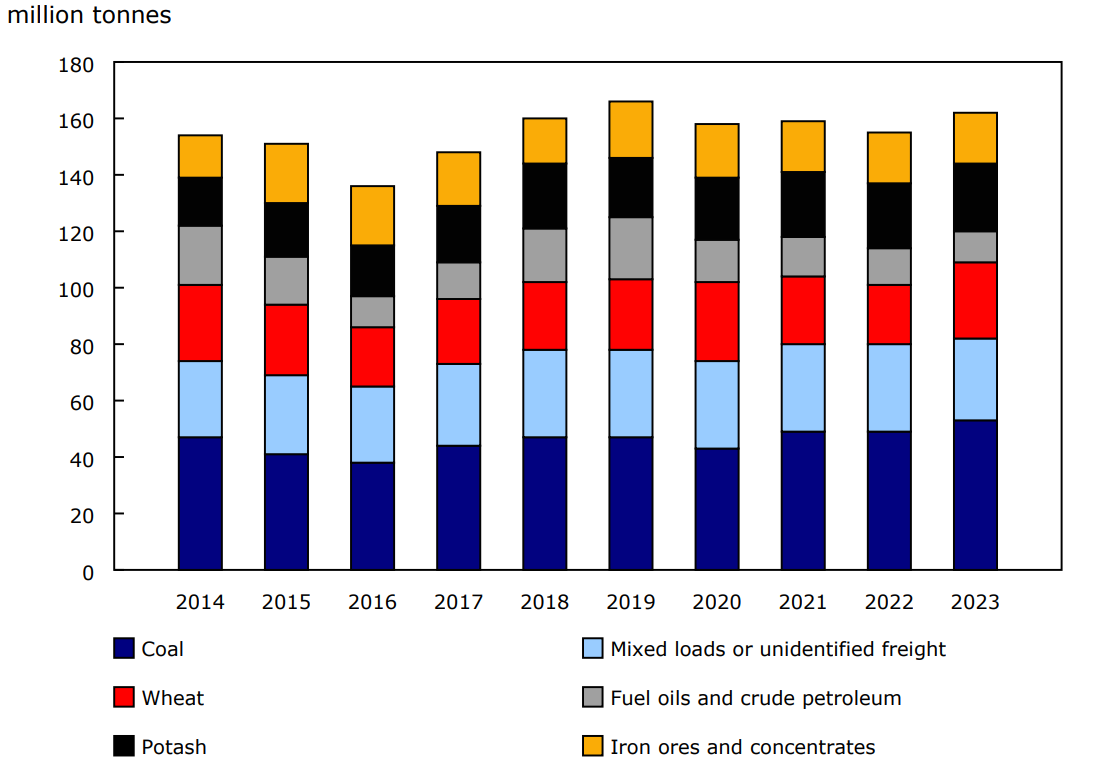
Some agricultural products saw higher volumes moved in 2023. The biggest increases were for wheat, up 28.9% to 26.9 million tonnes, and canola, up 20.7% to 8.3 million tonnes. To some extent, this reflected delivery and export of a bumper harvest across the Prairies in 2022. For example, loadings of wheat increased by an average of 1.2 million tonnes year over year each month from January to April 2023.
The volumes of other products such as coal (53.3 million tonnes) and potash (24.4 million tonnes) rebounded in 2023. In contrast, iron ores and concentrates (17.7 million tonnes) continued to decline, and fuel oils and crude petroleum (11.2 million tonnes) decreased for the fourth consecutive year.
Lumber rail tonnage declined for the second year in a row, down 6.4% in 2023 to 8.2 million tonnes.
Of the total volume of commodities originating from a Canadian location in 2023, nearly three-quarters (74.4%, or 205.2 million tonnes) came from Western Canada (Alberta, British Columbia, Saskatchewan and Manitoba).
Chart 3: Top six commodities transported by rail, 2014 to 2023
Description - Chart 3
Data table: Top six commodities transported by rail, 2014 to 2023
Source: Table 23-10-0062-01.
Note to readers
With this release, data from the Annual Survey on Rail Transportation have been revised back to 2018. These data include but are not limited to financial data, track length and train speed. This is the result of a review and updates to survey data.
This release is based on two data sources, an annual survey of the rail industry and administrative commodity origin and destination statistics from Transport Canada. The former collects financial as well as operating and employment data from a census of Canadian railways that provide for-hire freight and passenger services.
The commodity origin and destination statistics measure the movements of commodities carried by Canadian National Railway (CN), Canadian operations of Canadian Pacific Kansas City Railway (CPKC), carriers that interline with CN and CPKC, as well as a number of shortline carriers that do not interline with CN nor CPKC.
Financial, operational and origin and destination data may change on a year-over-year basis as a result of, for example, fluctuations in currency exchange rates and reclassifications of accounts. Data are also influenced by mergers, acquisitions and companies which may enter or exit the industry.
Data aggregations are available for Canada and select geographic regions.
It is important to note that the universe of shortline carriers changes regularly. In particular, in 2018, data from one company were added to the estimates for the first time. In previous years, this company was classified as inactive, and no estimates were made. Therefore, any comparison of 2018 data with those of previous years should be made with caution, as this constitutes a break in the series.
A shortline freight railway usually takes goods from one or more points to a point on the larger transportation network, which is usually a mainline railway but may be a trans-shipment point onto another transportation mode. These are carriers with less than $250 million in annual revenues for at least two years in a row.
Mainline freight railways usually move goods on the larger transportation network and are carriers with $250 million and more in annual revenues for at least two years in a row.
The Transportation Data and Information Hub, featuring data from Statistics Canada, Transport Canada and partners, provides Canadians with online access to comprehensive statistics and indicators for the country's transportation sector.
Reference
Data tables: Access the latest tables.
- Note: some data tables may best be viewed on desktop.
Definitions, data sources and methods: survey numbers 2734 and 2736.
Previous release: Rail transportation, 2022.
Contact information
For more information, or to enquire about the concepts, methods or data quality of this release, contact us (toll-free 1-800-263-1136; 514-283-8300; infostats@statcan.gc.ca) or Media Relations (statcan.mediahotline-ligneinfomedias.statcan@statcan.gc.ca).