

Household borrowing
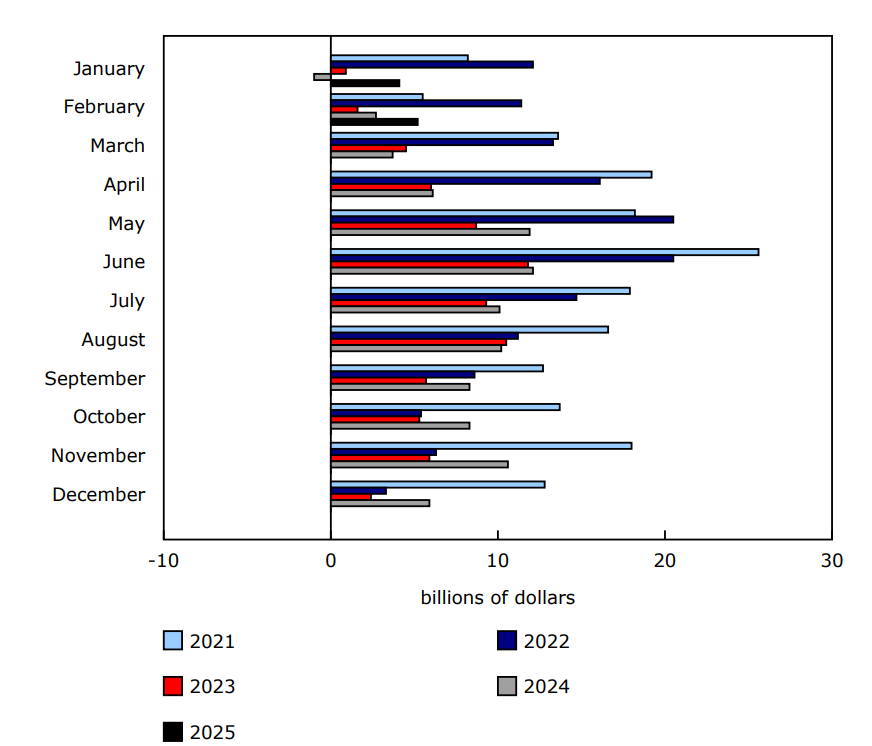
In February, the total credit liabilities of households rose 0.3% (+$10.1 billion) to reach $3,053.0 billion, accelerating from January on an annualized basis (+4.1% in February; +3.3% in January). Real estate secured debt, composed of both mortgage debt and home equity lines of credit, grew 0.4% (+$9.5 billion) in February. Household mortgage debt increased 0.4% (+$9.1 billion), following growth of $9.0 billion in the previous month. In February, the policy interest rate remained at 3.00%.
Chart 1: Month-over-month change in household mortgage loans
Description - Chart 1
Data table: Month-over-month change in household mortgage loans
.. not available for a specific reference period
Note: These data are unadjusted for seasonality.
Source: Table 36-10-0639-01.
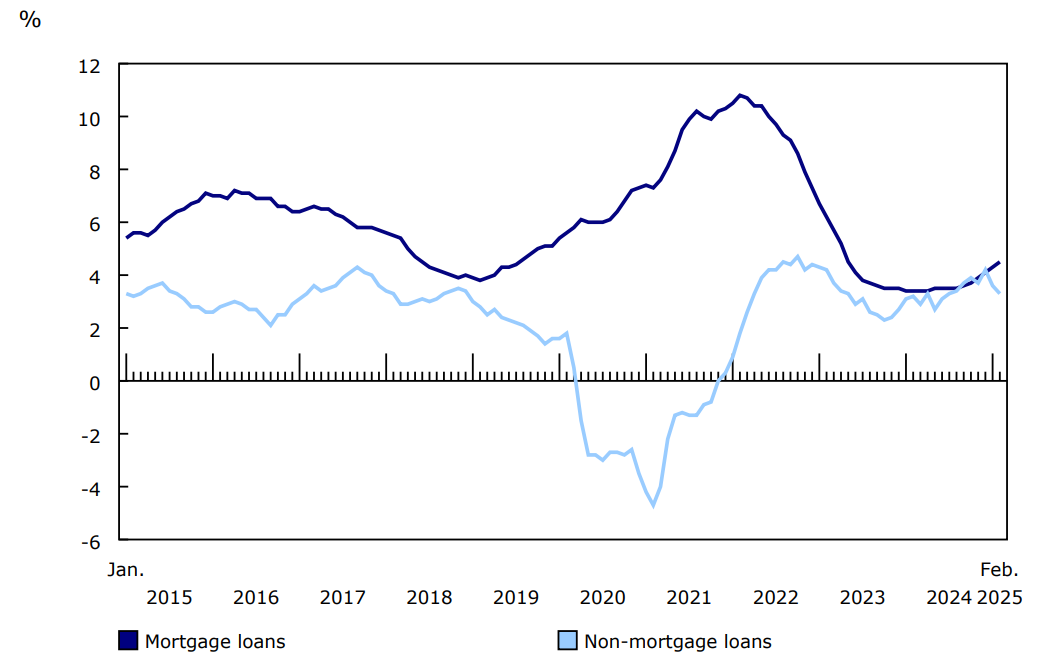
Chart 2: Year-over-year growth in household mortgage and non-mortgage loans
Description - Chart 2
Data table: Year-over-year growth in household mortgage and non-mortgage loans
Note: These data are unadjusted for seasonality.
Source: Table 36-10-0639-01.
Non-mortgage loan debt edged up 0.1% (+$1.0 billion) in February, following a 0.1% decrease in January. In February, outstanding balances on home equity lines of credit increased 0.3% (+$0.5 billion) and credit card debt with chartered banks increased 0.3% (+$0.3 billion), similar to the growth recorded in January. In February, the total of the remaining non-mortgage loan debt categories edged up 0.1%.
Private non-financial corporation borrowing
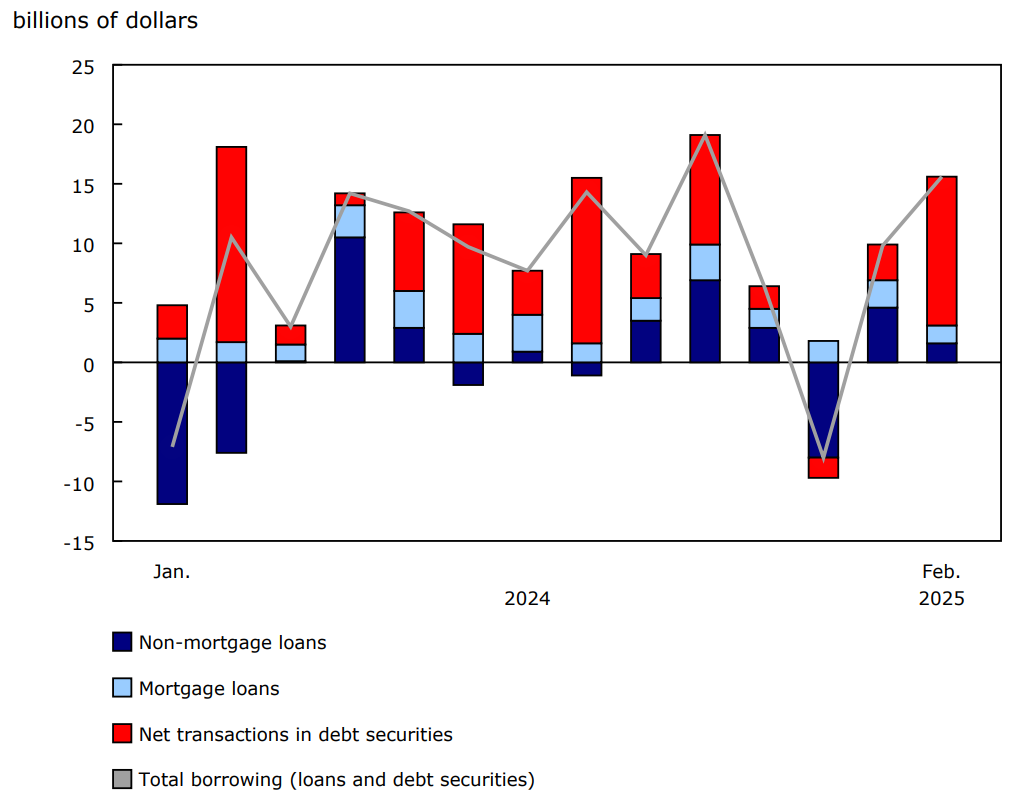
Total credit liabilities of private non-financial corporations increased 0.6% (+$14.2 billion) to reach $2,244.8 billion in February, a faster rise than in January. Non-mortgage loans with chartered banks edged up 0.2% (+$1.5 billion) in February, following a 1.0% increase in the previous month. Non-mortgage loans from government lenders edged down 0.1% in February while outstanding debt securities increased 1.3% (+$11.1 billion).
Chart 3: Private non-financial corporation borrowing
Description - Chart 3
Data table: Private non-financial corporation borrowing
Notes: Borrowing is defined as the month-to-month difference in the stock of outstanding loan liabilities plus the net transactions in debt securities. These data are unadjusted for seasonality.
Sources: Tables 36-10-0640-01 and 36-10-0670-01.
Overall borrowing by private non-financial corporations, composed of the change in the level of seasonally unadjusted outstanding loans and the net transactions in debt securities, was $15.6 billion in February, exceeding the January amount ($9.8 billion).
Note to readers
Unless otherwise stated, this release presents data adjusted for seasonality.
Annualized percentage changes shown in this release are calculated by taking the seasonally adjusted value for a given debt item and applying the following formula: (((debtm/debtm-1)12-1)*100), where "m" is the reference month.
Impact of acquisitions
In the month of January 2025, a sizeable acquisition took place involving two entities in different lending sectors. As a result, there are large movements in January 2025 between the bank and non-bank aggregates reflecting the shift in economic ownership of both non-mortgage and mortgage loan assets because of this acquisition. As such, household loans from chartered banks recorded a significant rise while household borrowing from trust companies and mortgage loan companies recorded a largely offsetting decline as these loan assets shifted between sectors. Combining both bank and non-bank aggregates provides a measure for the overall increase in household debt. There are routinely such acquisitions, if not necessarily as large, either of an entire entity by another or the acquisition of a portion of one entity's loan portfolio by another.
Revisions
This release of the monthly credit aggregates for the month of February 2025 includes revised estimates from January 2024 to January 2025. These data incorporate new and revised data, as well as updated data on seasonal trends.
Overview of the monthly credit aggregates
The monthly credit aggregates break down a portion of the quarterly National Balance Sheet Accounts (NBSA) by month. They provide details on lending to households and non-financial corporations—in other words, the stock of these sectors' outstanding liabilities from the debtor perspective—across a range of credit instruments, including mortgage loans, non-mortgage loans, and debt and equity securities. The aggregates cover all lending sectors, including chartered banks, non-bank deposit-taking institutions, other financial corporations, governments and other lenders. The estimates are presented as booked-in-Canada to capture activity within Canada, with either domestic or non-resident lenders. In addition, amounts are reported on an end-of-period basis (i.e., the value of the stock of an asset on the final day of the month). The third month of each quarter is benchmarked to the corresponding quarterly release of the NBSA.
Household sector borrowing is divided into financing in the form of non-mortgage loans (i.e., funds principally for consumption) and mortgage loans (i.e., debt acquired to finance the purchase of a property, whether residential or non-residential in nature). Household borrowing in the form of mortgage debt and home equity lines of credit is referred to as real estate secured debt and presents a further delineation of household liabilities associated with residential and non-residential properties.
As with the household sector, non-financial corporation borrowing is divided into non-mortgage and mortgage loans. However, overall credit liabilities of non-financial corporations also include their borrowing in the form of debt securities, with terms to maturity that are both short and long term in duration.
The NBSA are composed of the balance sheets of all sectors and subsectors of the economy. The main sectors are households, non-profit institutions serving households, financial corporations, non-financial corporations, governments and non-residents. The NBSA cover all national non-financial assets and all financial asset-liability claims outstanding in all sectors and, similarly, present stocks at the end of each quarter.
Estimates are available on a seasonally adjusted basis to improve the interpretability of period-to-period changes in debt. For information on seasonal adjustment, see the article "Seasonally adjusted data – Frequently asked questions."
For more information on the concepts, methodologies and classifications used to compile these monthly estimates, see the document "Guide to the Monthly Credit Aggregates."
Update
An update to the provincial and territorial Natural Resource Indicators has also been included with this release. See table 36-10-0624-01.
Reference
Data tables: Access the latest tables.
- Note: some data tables may best be viewed on desktop.
Definitions, data sources and methods: survey numbers 1804, 1806 and 5334.
Previous release: Monthly credit aggregates, January 2025.
Next release: May 20, 2025.
Contact information
For more information, or to enquire about the concepts, methods or data quality of this release, contact us (toll-free 1-800-263-1136; 514-283-8300; infostats@statcan.gc.ca) or Media Relations (statcan.mediahotline-ligneinfomedias.statcan@statcan.gc.ca).