
Highlights
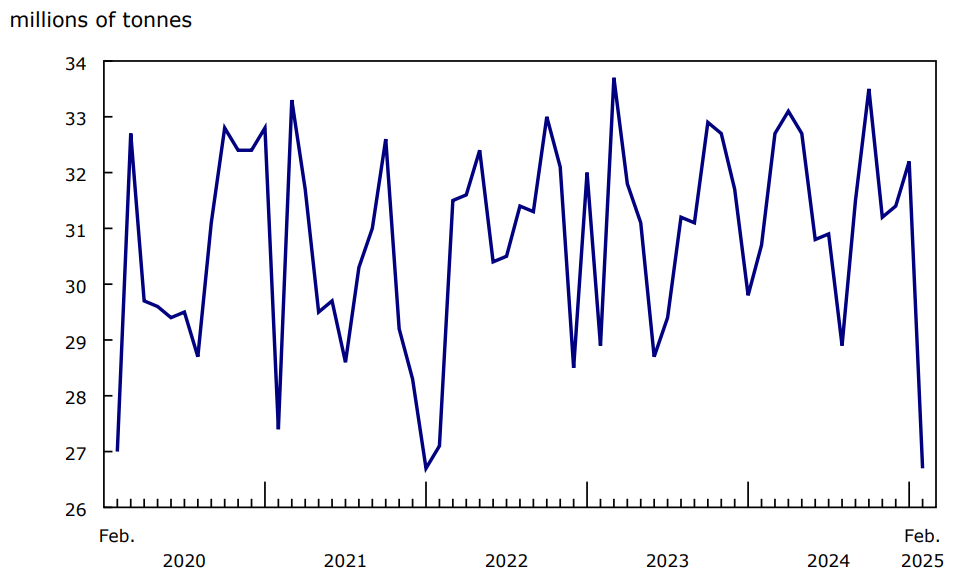
In February, the volume of cargo carried by Canadian railways reached 26.7 million tonnes, down 12.9% from February 2024, the steepest year-over-year decline in three years.
Rail freight transport typically slows during the winter months as colder temperatures restrict train lengths. In addition, this February had 28 days, compared with 29 days in 2024. Moreover, the announcements of tariff impositions by the United States have introduced uncertainty into some markets.
Indeed, volume in February 2025 was at its lowest level since 2019 and below the five-year average of 28.2 million tonnes for the month. Sharp declines were reported in the loadings of many commodities, including iron ores, wheat and potash.
To further explore the latest data and historical trends in an interactive format, please visit the "Monthly Railway Carloadings: Interactive Dashboard."
Chart 1: Railway carloadings, total tonnage
Description - Chart 1
Data table: Railway carloadings, total tonnage
Source: Table 23-10-0216-01.
The decrease in total freight carried in February was due to lower volumes across all types of rail operations: non-intermodal loadings (mainly commodities), intermodal loadings (mainly containers) and freight traffic from connections with American railways.
Carloadings of iron ores, wheat and potash lead decline
In February, non-intermodal rail operations in Canada fell 11.0% year over year to 21.4 million tonnes, with broad-based declines for many commodities.
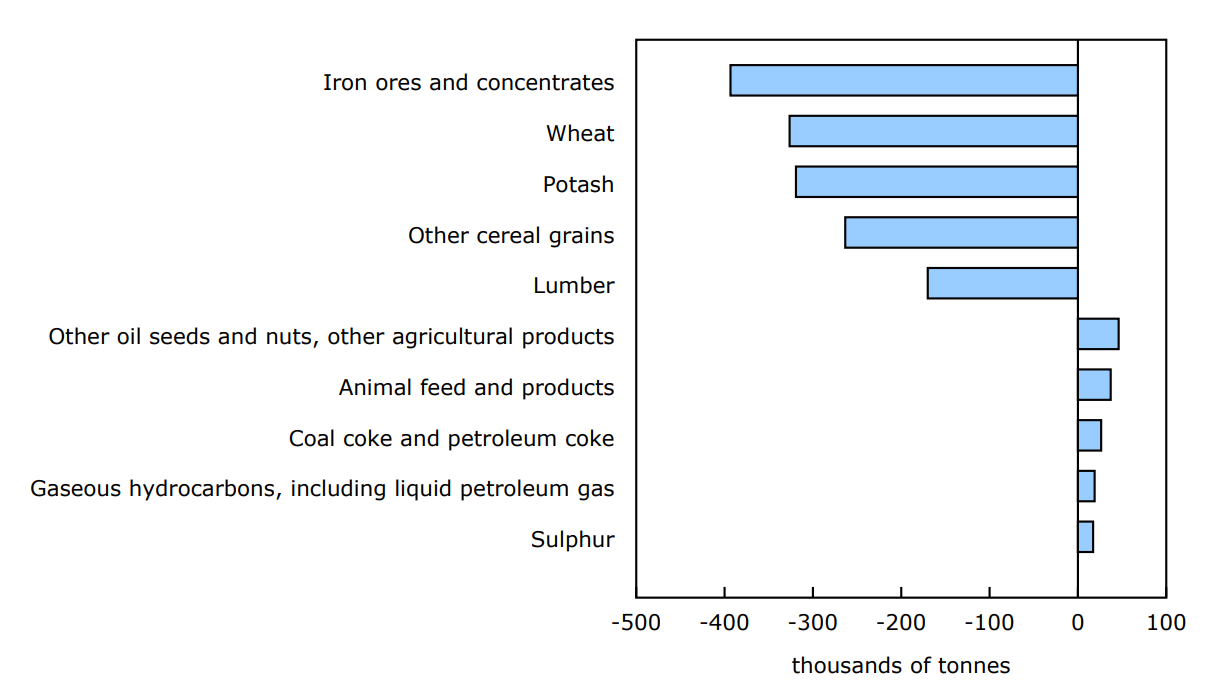
Iron ores and concentrates—feedstock to produce steel—led the pack, with loadings down by 8.6% (-393 000 tonnes) in February compared with February 2024. Canadian international merchandise trade statistics previously reported that Canada's exports of basic and semi-finished iron and steel products fell 11.2% year over year in February 2025, mostly on lower shipments to the United States. This decrease coincided with market volatility and supply uncertainty following an announcement earlier in the month by the United States to impose 25% tariffs on U.S. imports of steel and aluminium products, including those from Canada.
Loadings of wheat posted a year-over-year decrease of 14.6% (-326 000 tonnes) in February, following a gain of 43.1% in the previous month. A notable decrease was also reported for potash, down 16.3% (-319 000 tonnes) year over year.
Chart 2: Railway carloadings, largest commodity differences, February 2024 to February 2025
Description - Chart 2
Data table: Railway carloadings, largest commodity differences, February 2024 to February 2025
Source: Table 23-10-0216-01.
Some commodities edge up
Declines in non-intermodal freight loadings in February were offset to some extent by small tonnage increases for some commodities.
For example, loadings of other oil seeds and nuts, and other agricultural products rose 31.6% (+46 000 tonnes) in February compared with the same month in 2024, while loadings of animal feed and products posted a year-over-year increase of 9.0% (+37 000 tonnes).
Intermodal traffic lower
In February 2025, intermodal shipments—mainly containers—originating in Canada were down 10.5% year over year to 2.6 million tonnes.
American freight down sharply
Freight traffic from US rail connections fell 27.2% (or -1.0 million tonnes) to reach 2.7 million tonnes in February—the lowest level for the month of February in eight years.
Focus on Canada and the United States
At 2.7 million tonnes, freight traffic from US rail connections in February was the lowest level of any month since June 2020, when many factories and other facilities were idle because of COVID-19 restrictions.
Railway carloadings received from US connections represented on average 12.0% of total rail tonnage over 2023 and 2024. This proportion edged down to 11.2% in January 2025 and then fell to 10.1% in February. Statistics Canada will continue to monitor potential impacts of tariffs on railway carloading statistics.
For more data and insights on areas touched by the socio-economic relationship between Canada and the United States, see the Focus on Canada and the United States webpage.
Note to readers
The Monthly Railway Carloadings Survey collects data on the number of rail cars, tonnage, units and 20-feet equivalent units from railway transporters operating in Canada that provide for-hire freight services.
Cargo loadings from Armstrong, Ontario, to the Atlantic Coast are classified to the eastern division (Eastern Canada), while loadings from Thunder Bay, Ontario, to the Pacific Coast are classified to the western division (Western Canada).
Survey data are revised on a monthly basis to reflect new information.
The data in this release are not seasonally adjusted.
The Transportation Data and Information Hub, featuring data from Statistics Canada, Transport Canada and partners, provides Canadians with online access to comprehensive statistics and indicators for the country's transportation sector.
Reference
Data table: 23-10-0216-01.
- Note: some data tables may best be viewed on desktop.
Definitions, data sources and methods: survey number 2732.
Previous release: Railway carloadings, January 2025.
Contact information
For more information, or to enquire about the concepts, methods or data quality of this release, contact us (toll-free 1-800-263-1136; 514-283-8300; infostats@statcan.gc.ca) or Media Relations (statcan.mediahotline-ligneinfomedias.statcan@statcan.gc.ca).