

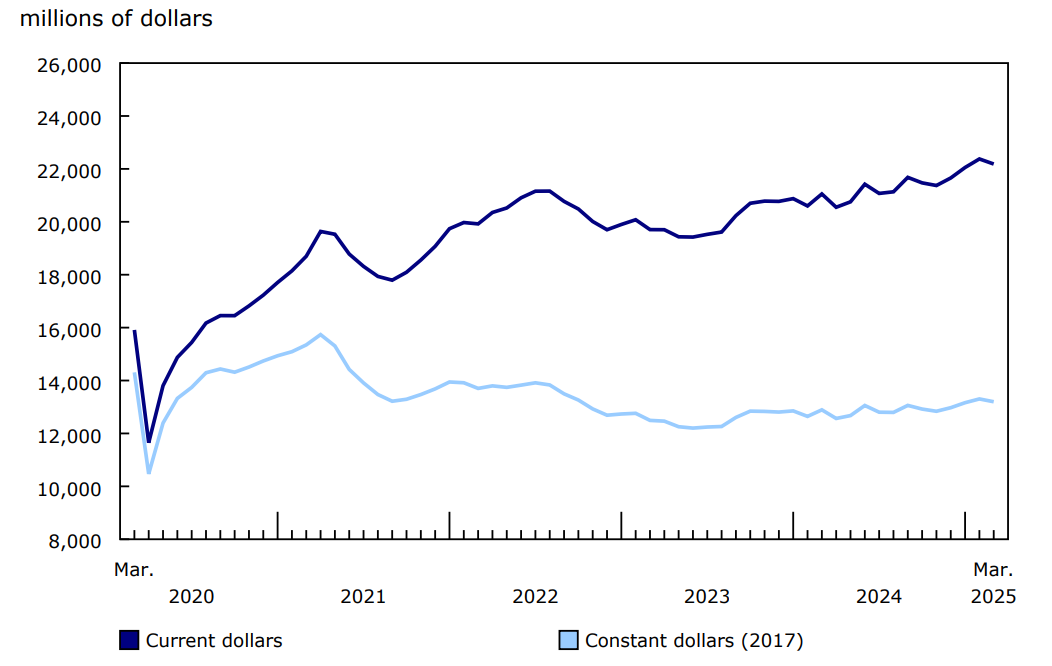
Overall, investment in building construction decreased 0.9% (-$192.2 million) to $22.2 billion in March. The residential sector declined 1.8% to $15.3 billion while the non-residential sector was up 1.3% to $6.8 billion. Year over year, investment in building construction grew 5.4% in March.
On a constant dollar basis (2017=100), investment in building construction decreased 0.8% from the previous month to $13.2 billion in March and was up 2.4% year over year.
Chart 1: Investment in building construction, seasonally adjusted
Description - Chart 1
Data table: Investment in building construction, seasonally adjusted
Source: Table 34-10-0286-01.
Multi-unit component drags down residential sector
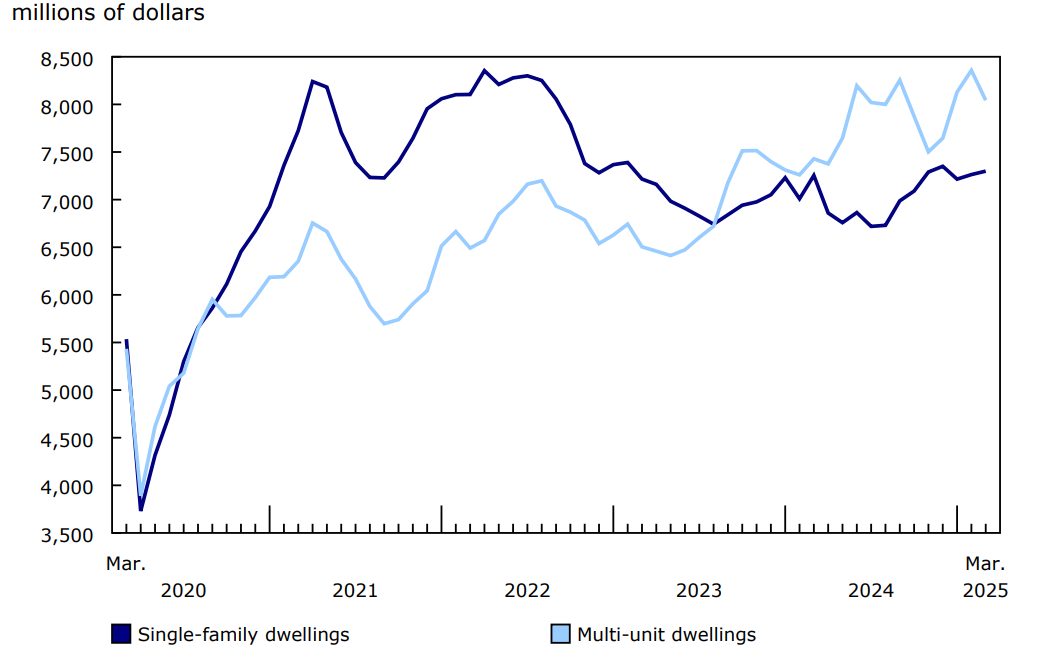
Investment in residential building construction decreased by $277.7 million to $15.3 billion in March. The decrease was driven by multi-unit construction (-3.8%) and tempered by single-family home investment (+0.5%).
Investment in multi-unit construction declined by $313.9 million to $8.0 billion in March. The monthly decline was largely attributed to Ontario (-$130.8 million) and Quebec (-$111.6 million). Meanwhile, New Brunswick (+$17.2 million) saw the largest increase, followed by three other provinces.
Single family home investment edged up by $36.2 million to $7.3 billion in March. Growth in five provinces and one territory, led by Quebec (+$131.6 million) and Manitoba (+$38.2 million), was largely mitigated by decreases in Ontario (-$96.8 million) and Alberta (-$53.1 million).
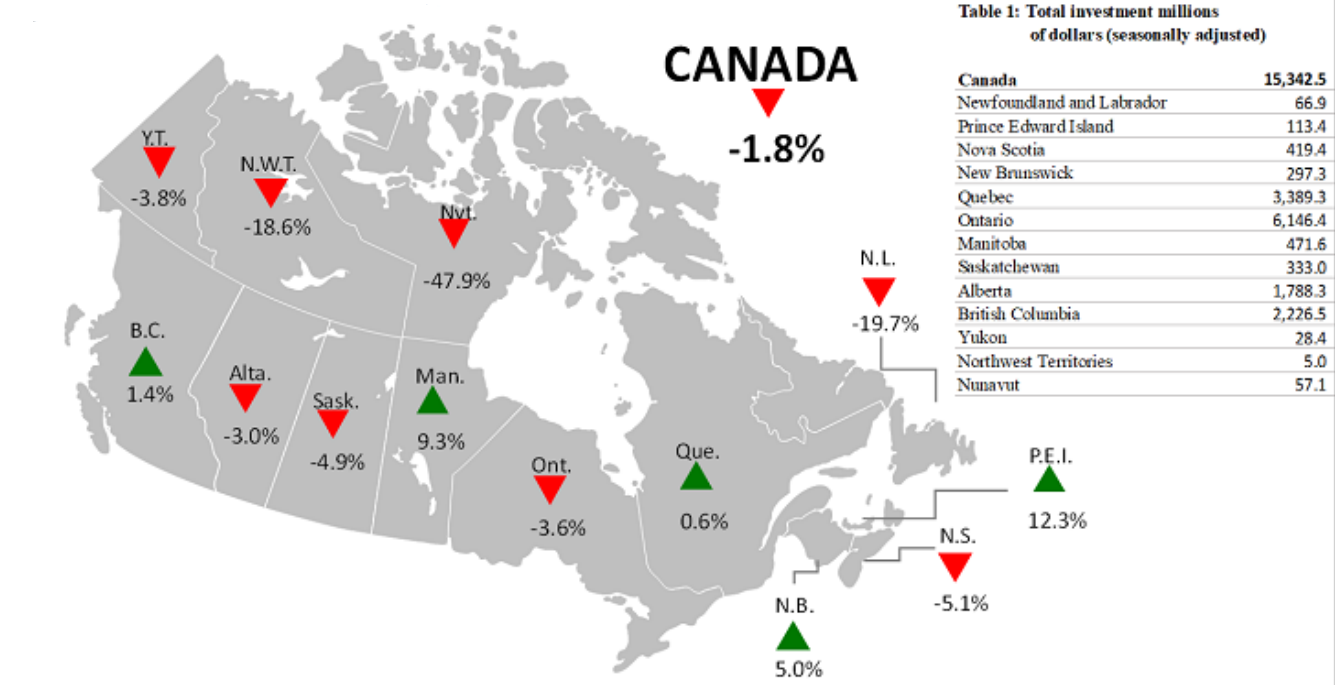
Figure 1: Month-to-month change in residential construction investment (seasonally adjusted)
Description - Figure 1
This is a map of Canada by province and territory, showing the month-to-month percentage changes for investment in residential building construction. Green arrows pointing upward represent an increase, while red arrows pointing downward represent a decrease.
Investment in residential construction for Canada decreased 1.8% in March compared with February 2025. Newfoundland and Labrador was down 19.7%, Prince Edward Island was up 12.3%, Nova Scotia was down 5.1%, New Brunswick was up 5.0%, Quebec was up 0.6%, Ontario was down 3.6%, Manitoba was up 9.3%, Saskatchewan was down 4.9%, Alberta was down 3.0%, British Columbia was up 1.4%, Yukon was down 3.8%, Northwest Territories was down 18.6% and Nunavut was down 47.9%.
Table 1: Total investment, millions of dollars (seasonally adjusted).
Total investment for Canada was $15,342.5 million, total investment for Newfoundland and Labrador was $66.9 million, total investment for Prince Edward Island was $113.4 million, total investment for Nova Scotia was $419.4 million, total investment for New Brunswick was $297.3 million, total investment for Quebec was $3,389.3 million, total investment for Ontario was $6,146.4 million, total investment for Manitoba was $471.6 million, total investment for Saskatchewan was $333.0 million, total investment for Alberta was $1,788.3 million, total investment for British Columbia was $2,226.5 million, total investment for Yukon was $28.4 million, total investment for Northwest Territories was $5.0 million and total investment for Nunavut was $57.1 million.
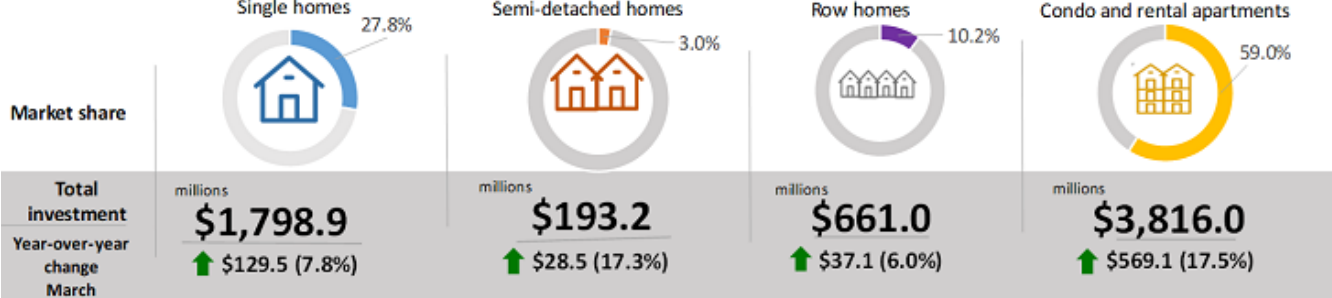
Figure 2: Investment in residential construction, market share and year-over-year change (seasonally adjusted)
Description - Figure 2
Single homes: Market share was 27.8% and total investment totalled $1,798.9 million, representing a year-over-year increase of 7.8% or $129.5 million.
Semi-detached homes: Market share was 3.0% and total investment totalled $193.2 million, representing a year-over-year increase of 17.3% or $28.5 million.
Row homes: Market share was 10.2% and total investment totalled $661.0 million, representing a year-over-year increase of 6.0% or $37.1 million.
Condos and rental apartments: Market share was 59.0% and total investment totalled $3,816.0 million, representing a year-over-year increase of 17.5% or $569.1 million.
Note: Single homes value excludes cottages and mobile homes.
Source: Table 34-10-0286-01.
Chart 2: Investment in residential building construction, seasonally adjusted
Description - Chart 2
Data table: Investment in residential building construction, seasonally adjusted
Source: Table 34-10-0286-01.
British Columbia leads growth in non-residential investment
Investment in non-residential construction increased by $85.5 million to $6.8 billion in March, marking the eighth consecutive monthly increase. The growth was spread across the three non-residential subsectors in March, with gains in the institutional (+2.4%), commercial (+1.0%), and industrial (+0.3%) components.
Investment in the institutional component grew by $47.4 million to $2.0 billion in March. Gains were recorded in seven provinces and two territories, led by Saskatchewan (+$18.5 million) and British Columbia (+$11.5 million).
Commercial construction investment rose by $32.9 million to $3.3 billion in March. Gains were led by British Columbia (+$26.2 million) and Ontario (+$11.6 million). Quebec (-$11.1 million) tempered the growth in the commercial component.
The industrial component edged up by $5.2 million to $1.5 billion in March. Declines were recorded in eight provinces and two territories, while growth was observed in Alberta (+$9.5 million) and Quebec (+$5.3 million) and in Yukon (+$0.2 million).
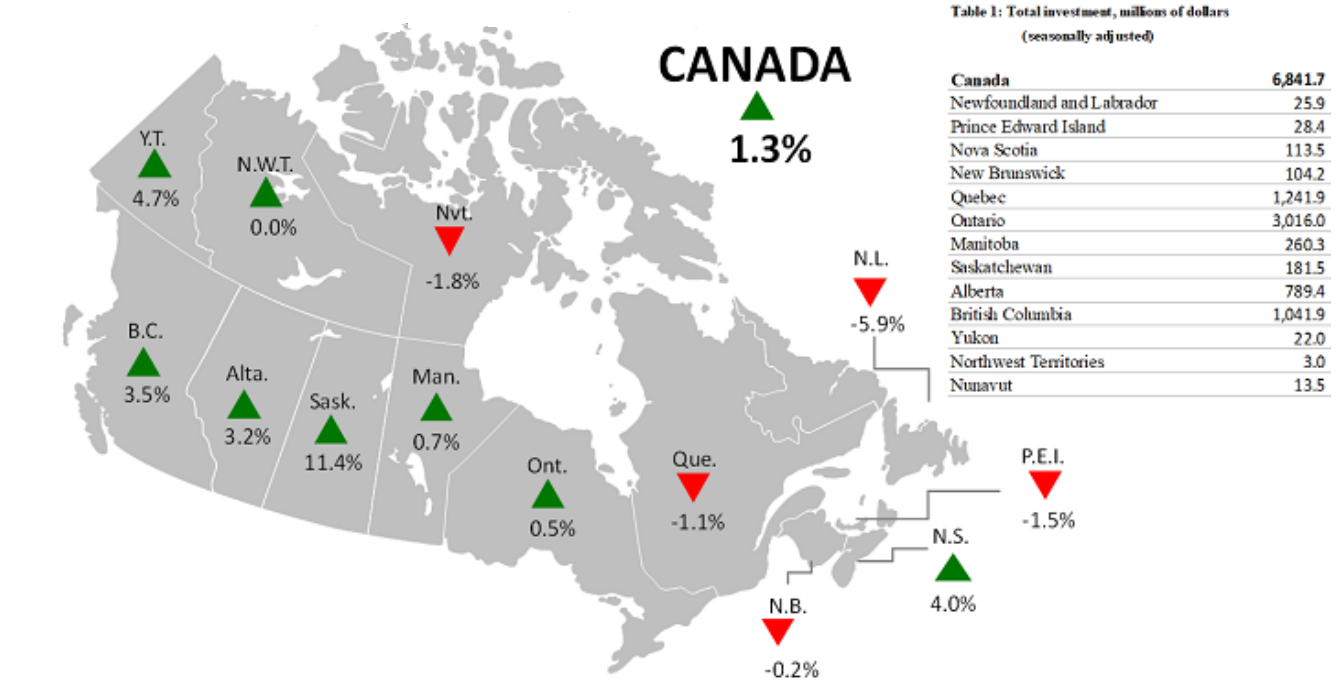
Figure 3: Month-to-month change in non-residential construction investment (seasonally adjusted)
Description - Figure 3
This is a map of Canada by province and territory, showing the month-to-month percentage changes for investment in non-residential building construction. Green arrows pointing upward represent an increase, while red arrows pointing downward represent a decrease.
Investment in non-residential for Canada increased 1.3% in March compared with February 2025. Newfoundland and Labrador was down 5.9%, Prince Edward Island was down 1.5%, Nova Scotia was up 4.0%, New Brunswick was down 0.2%, Quebec was down 1.1%, Ontario was up 0.5%, Manitoba was up 0.7%, Saskatchewan was up 11.4%, Alberta was up 3.2%, British Columbia was up 3.5%, Yukon was up 4.7%, Northwest Territories was up 0.0% and Nunavut was down 1.8%.
Table 1: Total investment, millions of dollars (seasonally adjusted).
Total investment for Canada was $6,841.7 million, total investment for Newfoundland and Labrador was $25.9 million, total investment for Prince Edward Island was $28.4 million, total investment for Nova Scotia was $113.5 million, total investment for New Brunswick was $104.2 million, total investment for Quebec was $1,241.9 million, total investment for Ontario was $3,016.0 million, total investment for Manitoba was $260.3 million, total investment for Saskatchewan was $181.5 million, total investment for Alberta was $789.4 million, total investment for British Columbia was $1,041.9 million, total investment for Yukon was $22.0 million, total investment for Northwest Territories was $3.0 million and total investment for Nunavut was $13.5 million.
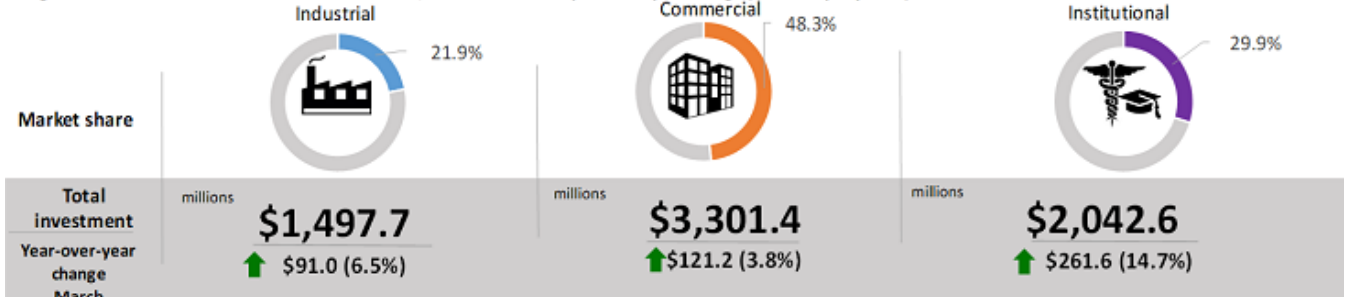
Figure 4: Investment in non-residential construction, market share and year-over-year change (seasonally adjusted)
Description - Figure 4
Industrial: Market share was 21.9% and total investment totalled $1,497.7 million, representing a year-over-year increase of 6.5% or $91.0 million.
Commercial: Market share was 48.3% and total investment totalled $3,301.4 million, representing a year-over-year increase of 3.8% or $121.2 million.
Institutional: Market share was 29.9% and total investment totalled $2,042.6 million, representing a year-over-year increase of 14.7% or $261.6 million.
Source: Table 34-10-0286-01.
First quarter summary: Non-residential growth leads first quarter gains
Investment in building construction grew 3.3% to $66.6 billion in the first quarter of 2025. Year over year, investment in building construction grew 6.5% in the first quarter.
Investment in the non-residential sector was up 2.8% to $20.3 billion in the first quarter. The quarterly growth was largely due to gains in Ontario (+$401.4 million), along with seven other provinces and two territories. The overall institutional component recorded the largest increase (+5.6%), followed by the industrial component (+3.7%) and the commercial component (+0.8%).
Investment in the residential sector increased 3.5% to $46.3 billion in the first quarter, led by the multi-unit component (+6.5%), while single family home investment edged up 0.2%.
For more information on construction, please visit the Construction statistics portal.
For more information on housing, please visit the Housing statistics portal.
Note to readers
Table 34-10-0175 has been archived on the Statistics Canada website and will no longer be updated but may still be viewed. The successor table is 34-10-0286, and the information from January 2017 onwards that was in table 34-10-0175 is still available in the new table, except for the constant dollar series, which has been rebased to 2017=100. Constant dollar data for January and February 2017 represent an average between the old base year (2012=100) and the new base year (2017=100) and should be used with caution. The 2017 data series will be backcasted and the figures will be revised with the release of our annual revision.
Data are subject to revisions based on late responses, delayed construction start dates for large projects, methodological changes, classification updates, price index updates for constant dollar series, benchmarking and adjustments to ad hoc macroeconomic events. Unadjusted data have been revised back to January 2023. Seasonally adjusted data have been revised back to January 2017.
Data presented in this release are seasonally adjusted with current dollar values unless otherwise stated. Using seasonally adjusted data allows month-to-month and quarter-to-quarter comparisons by removing the effects of seasonal variations. For information on seasonal adjustment, see Seasonally adjusted data—Frequently asked questions.
Monthly estimates for constant dollars are calculated using quarterly deflators from the Building Construction Price Index (18-10-0276-01). The monthly indexes used for the deflation process were part of a methodology review to increase the quality of the constant dollar and seasonally adjusted series. The indexes previously displayed a step pattern because of less frequent collection.
Detailed data on investment activity by type of building and type of work are now available in the unadjusted current dollar series.
The trade and services subcomponent includes buildings such as retail and wholesale outlets, retail complexes and motor vehicle show rooms. More detailed information can be found on the Integrated Metadatabase at Types of Building Structure - 2.2.1 - Trade and services.
Reference
Data table: 34-10-0286-01.
- Note: some data tables may best be viewed on desktop.
Definitions, data sources and methods: survey number 5014.
Previous release: Investment in building construction, February 2025.
Next release: June 19, 2025.
Contact information
For more information, or to enquire about the concepts, methods or data quality of this release, contact us (toll-free 1-800-263-1136; 514-283-8300; infostats@statcan.gc.ca) or Media Relations (statcan.mediahotline-ligneinfomedias.statcan@statcan.gc.ca).