

Primary energy production increased 6.2% year over year to 2.1 million terajoules in March, with five of the six energy subsectors posting gains. Secondary energy production edged up 0.6%, with refined petroleum products contributing the most to the increase.
Chart 1: Year-over-year contribution to change in primary energy production
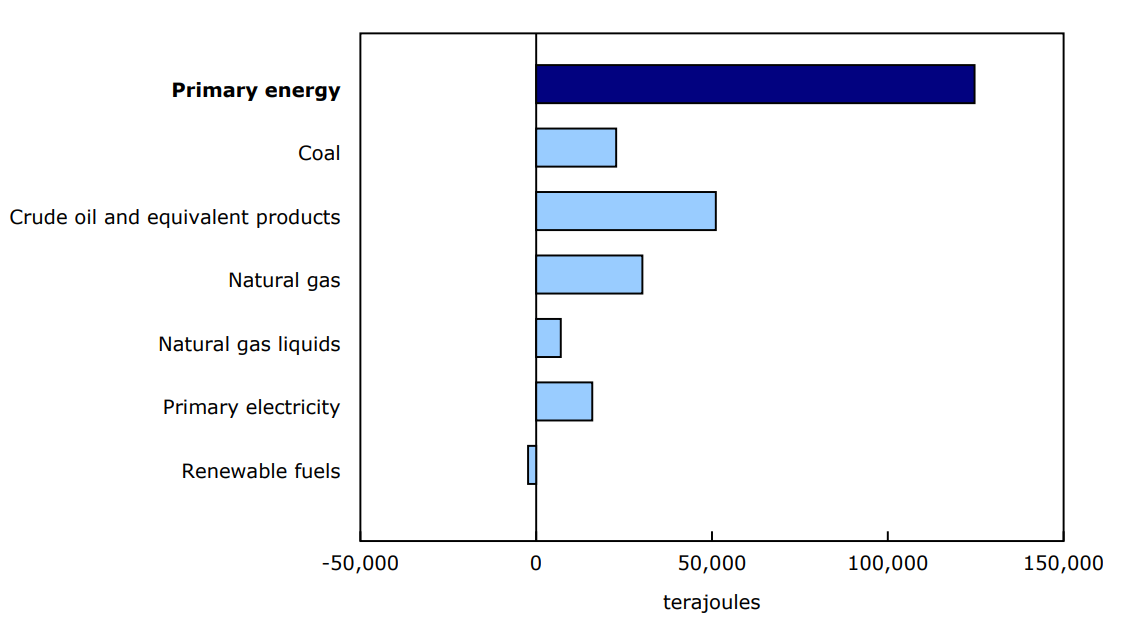
Description - Chart 1
Data table: Year-over-year contribution to change in primary energy production.
Source: Table 25-10-0079-01.
For more information on energy in Canada, including production, consumption, international trade and much more, visit the Canadian Centre for Energy Information portal and follow #energynews on social media.
The 2024 energy year-in-review articles on crude oil and electricity are now available in StatsCAN Plus.
Another record year for Canadian crude oil: Crude oil year in review, 2024
Dry weather dampens overall generation: Electricity year in review, 2024
Coming soon, 2024-year-in-review articles on natural gas and refined petroleum products.
Crude oil production near record high as exports to countries other than the United States continue to rise in March
Crude oil production reached 26.8 million cubic metres in March, up 5.1% from the same month one year earlier. This was the second-highest volume in the series, following record production in December 2024 (27.1 million cubic metres).
Oil sands extraction contributed the most to the gain in March 2025, up 3.7% to 17.5 million cubic metres. Both synthetic crude (+5.7%) and crude bitumen (+2.4%) production were up, as most upgraders and mines were running at near maximum capacity before the start of the spring maintenance period. Meanwhile, production of light and medium crude oil rose 11.9% to 4.4 million cubic metres.
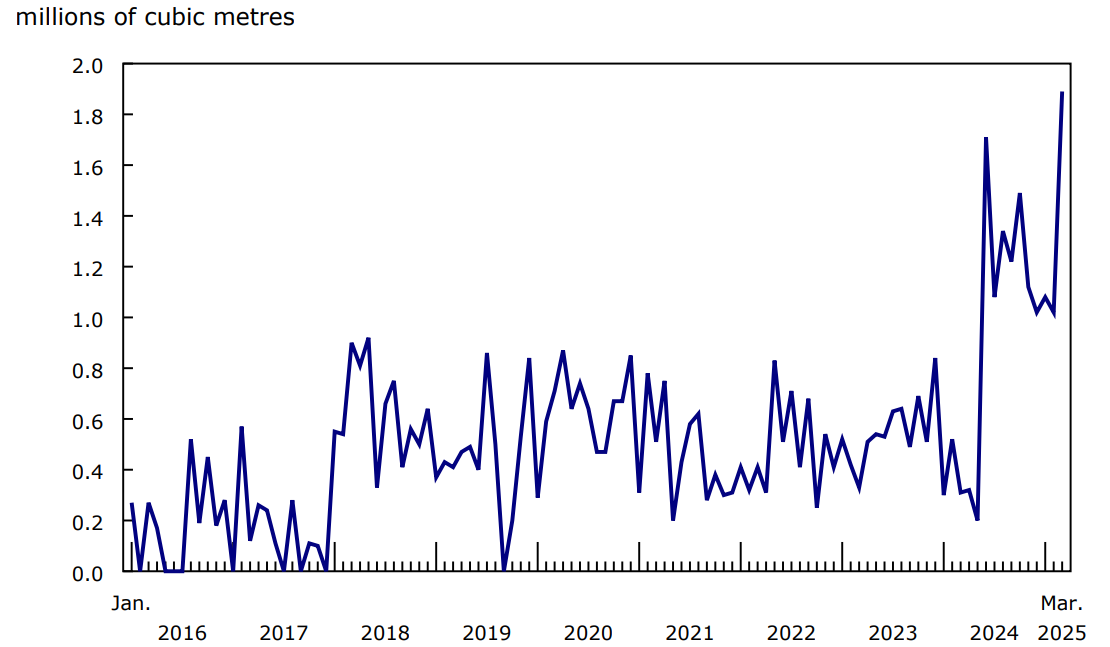
Exports of crude oil were down 1.1% year over year to 20.2 million cubic metres in March, due to lower volumes shipped to the United States by pipelines (-9.5%). In contrast, exports to countries other than the United States rose sixfold to 1.9 million cubic metres, a new series high. The increase was driven by exports shipped through the Trans Mountain pipeline to the west coast and destined for the Asian market. Exports from Newfoundland and Labrador (+155.1% to 0.8 million cubic metres), fuelled by increased offshore production in the province, also contributed to the overall year-over-year rise.
Chart 2: Canadian exports of crude oil to countries other than the United States
Description - Chart 2
Data table: Canadian exports of crude oil to countries other than the United States.
Source: Table 25-10-0063-01.
Record natural gas production in Alberta fuels national increase
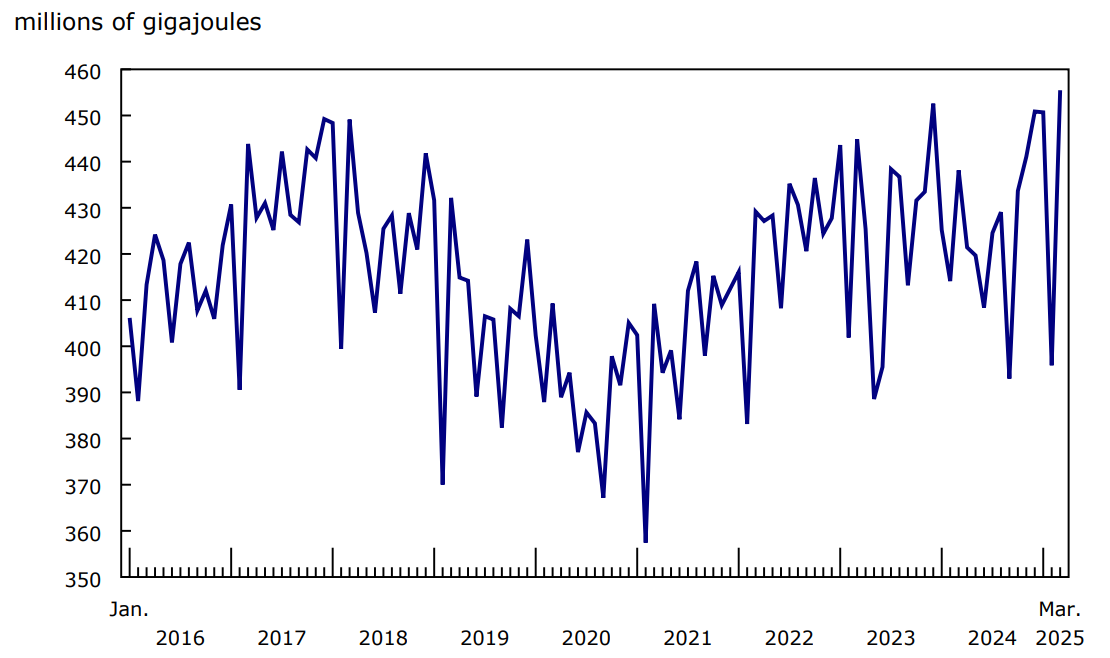
Production of marketable natural gas climbed 4.4% year over year to 714.8 million gigajoules in March, the third-highest production value ever recorded, behind December 2024 (716.9 million gigajoules) and January 2025 (715.4 million gigajoules). The increase in March was driven by Alberta (+4.0%), which saw record high production (455.5 million gigajoules).
Exports of natural gas to the United States rose 14.7% year over year to 316.2 million gigajoules in March, due in part to increased demand driven by lower natural gas prices.
Chart 3: Production of natural gas in Alberta
Electricity exports to the United States down, leading to a net importer position in March
In March, imports of electricity declined 24.5% year over year to 2.5 million megawatt-hours (MWh) and exports rose 3.1% to 2.0 million MWh.
On a month-over-month basis, exports fell sharply by 41.2% in March compared with February. The driver of the decrease in March was Quebec, where exports dropped 83.8% month over month due to warmer spring weather and lower prices in the United States.
This marked the first month since April 2024 that Canada imported more electricity than it exported.
Total electricity generation in Canada rose 9.1% year over year to 56.6 million MWh in March 2025. This was the fourth consecutive month of year-over-year increases and came in the context of improving drought conditions and rebounding hydroelectric generation, which was up 10.3% to 32.6 million MWh in March.
Chart 4: Canadian imports and exports of electricity
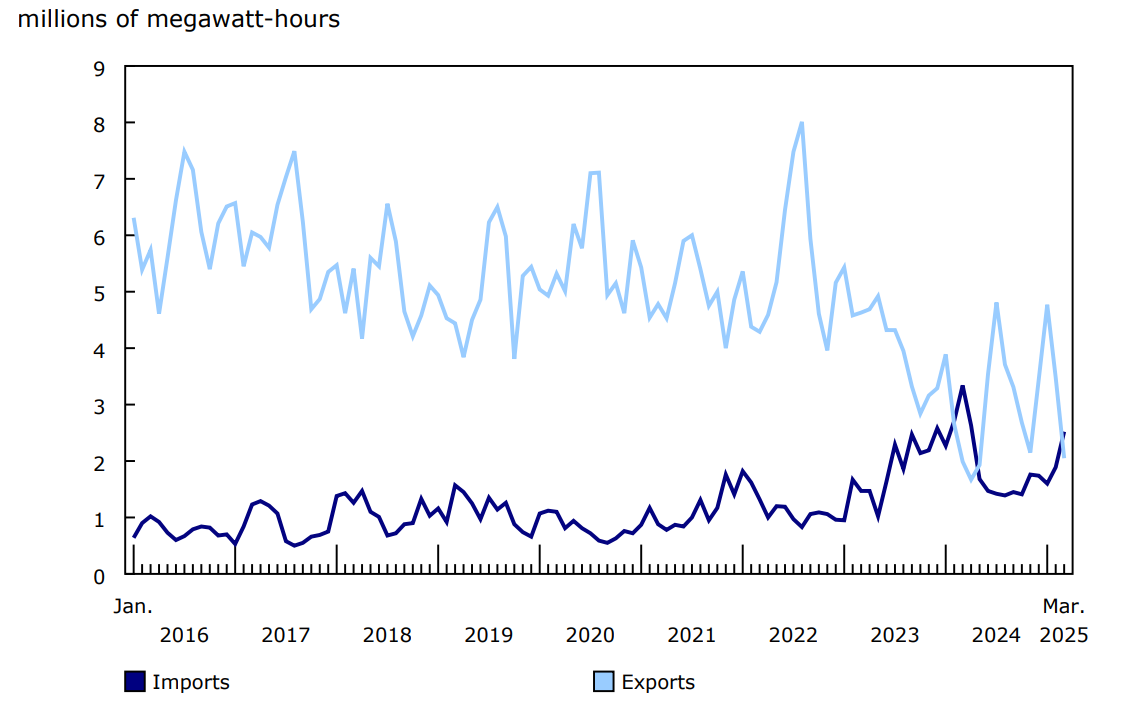
Description - Chart 4
Data table: Canadian imports and exports of electricity.
Source: Table 25-10-0016-01.
Production and consumption of refined petroleum products up in March
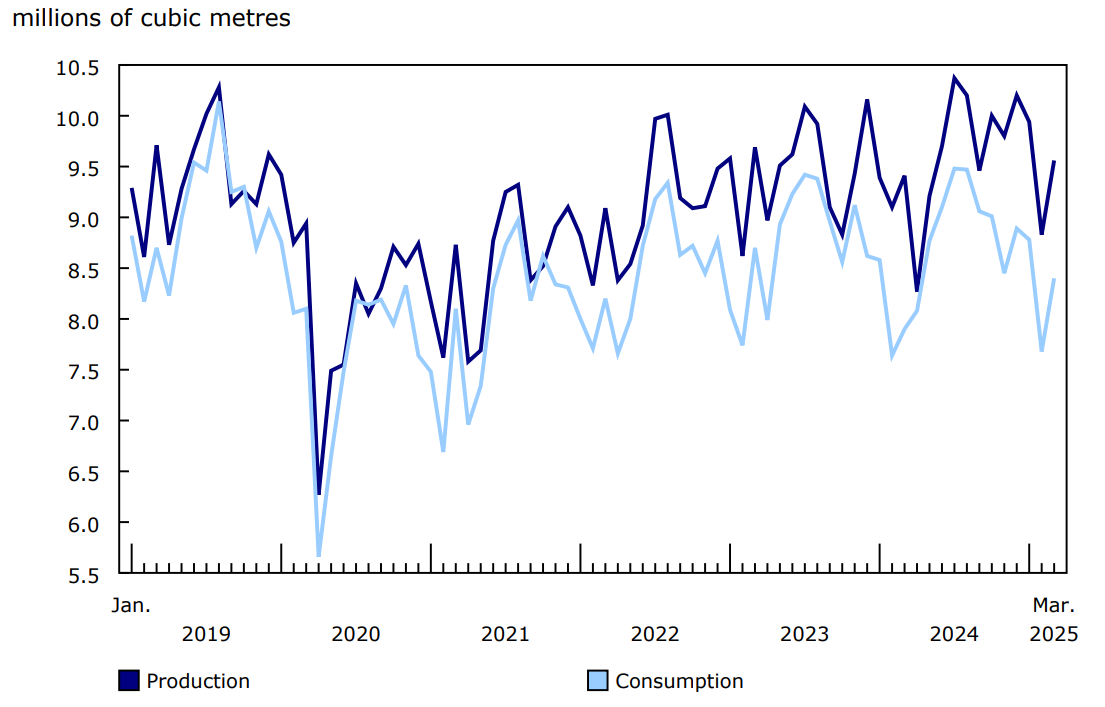
Production of refined petroleum products rose 1.6% year over year to 9.6 million cubic metres in March. The increase was led by kerosene-type jet fuel (+11.5%) and distillate fuel oil (+1.0%).
Consumption of refined petroleum products climbed 6.2% year over year to 8.4 million cubic metres in March. Kerosene-type jet fuel led the increase (+35.8%), followed by finished motor gasoline (+2.7%) and distillate fuel oil (+0.3%).
Chart 5: Canadian production and consumption of refined petroleum products
Description - Chart 5
Data table: Canadian production and consumption of refined petroleum products.
Source: 25-10-0081-01.
Focus on Canada and the United States
During the first quarter, Canada produced 6.1 million terajoules of primary energy, over 60% of which was destined for the export market.
Crude oil exports to the United States fell 8.9% to 18.3 million cubic metres in March. This was the lowest daily export level (589.2 thousand cubic metres/day) since April 2023. The decline in March 2025 was driven by lower exports by pipeline, which fell 9.5% from the series high observed in March 2024 (19.0 million cubic metres). Exports to the United States by other means slightly offset the decline in March 2025, rising 1.5% to 1.1 million cubic metres.
For more data and insights on areas touched by the socio-economic relationship between Canada and the United States, see the Focus on Canada and the United States webpage.
Note to readers
The Energy Statistics Program relies on data collected from respondents and administrative sources.
The Consolidated Energy Statistics table (25-10-0079-01) presents monthly data on primary and secondary energy by fuel type (crude oil, natural gas, electricity, coal, etc.) in terajoules and supply and demand characteristics (production, exports, imports, etc.) for Canada. For more information, consult the Consolidated Energy Statistics Table: User Guide.
Data in this release are not seasonally adjusted.
The following survey programs support the "Energy statistics" release:
- Crude oil and natural gas (survey number 2198; tables 25-10-0036-01, 25-10-0055-01 and 25-10-0063-01)
- Energy transportation and storage (survey number 5300; tables 25-10-0075-01 and 25-10-0077-01)
- Natural gas transmission, storage and distribution (survey numbers 2149, 5210 and 5215; tables 25-10-0057-01, 25-10-0058-01 and 25-10-0059-01)
- Refined petroleum products (survey number 2150; table 25-10-0081-01).
- Renewable fuel and hydrogen (survey number 5294; table 25-10-0082-01)
- Electric power statistics (survey number 2151; tables 25-10-0015-01 and 25-10-0016-01)
- Coal and coke statistics (survey numbers 2147 and 2003; tables 25-10-0045-01 and 25-10-0046-01).
The newly expanded Trans Mountain pipeline began operation in May 2024, transporting crude oil and refined petroleum products from Edmonton, Alberta, to the port of Burnaby, British Columbia. This expansion nearly tripled the capacity of the existing line built in 1953, allowing for more Canadian crude oil to be exported to the global market. As a result, year-over-year rates of change are expected to be significant for some data series through to April 2025.
Revisions
Energy survey data and administrative sources are subject to revisions to reflect new or updated information. Historical revisions will be processed periodically.
With this release, revisions have been made to the following data series:
- Table 25-10-0046-01: monthly coal production and export data have been revised for the period from January 2024 to February 2025.
- Table 25-10-0045-01: monthly coal coke plant data have been revised for the period from October 2024 to February 2025.
- Table 25-10-0081-01: petroleum products data have been revised for the period from January 2023 to February 2025.
- Table 25-10-0082-01: renewable fuel plant statistics data have been revised for the period from September 2024 to February 2025.
- Table 25-10-0057-01: Canadian natural gas storage data have been revised for the period from December 2024 to February 2025.
- Table 25-10-0058-01: Canadian monthly natural gas transmission data have been revised for the period from January 2024 to February 2025.
- Table 25-10-0059-01: Canadian monthly natural gas distribution data have been revised for the month of January 2024 and the period from November 2024 to January 2025.
- Table 25-10-0036-01: natural gas liquids and sulphur products from processing plants data have been revised for the period from January 2024 to February 2025.
- Table 25-10-0055-01: supply and disposition of natural gas data have been revised for the period from January 2024 to February 2025.
- Table 25-10-0063-01: supply and disposition of crude oil and equivalent data have been revised for the period from December 2023 to February 2025.
- Table 25-10-0079-01: consolidated energy statistics have been revised for the period from January 2023 to February 2025 to incorporate data from the above-mentioned revisions.
Occasionally, data from Environment and Climate Change Canada are referenced by the Energy Statistics Program using Cooling Degree Days (CDDs) or Heating Degree Days (HDDs) as a measure of temperature. CDDs reflect the relationship between outdoor temperatures and the need to cool indoors to maintain room temperature. As temperatures outside rise, the number of CDDs increases. HDDs are the opposite and reflect the need to heat indoors to maintain room temperature. As temperatures outside fall, the number of HDDs increases.
Reference
Data tables: Access the latest tables.
- Note: some data tables may best be viewed on desktop.
Definitions, data sources and methods: See the associated survey numbers.
Previous release: Energy statistics, February 2025.
Contact information
For more information, or to enquire about the concepts, methods or data quality of this release, contact us (toll-free 1-800-263-1136; 514-283-8300; infostats@statcan.gc.ca) or Media Relations (statcan.mediahotline-ligneinfomedias.statcan@statcan.gc.ca).