

The Canadian electricity sector saw another challenging year in 2024. Many of the factors and trends observed in 2023 played a role again in 2024, particularly the persistent dry conditions that continued to reduce hydroelectricity generation, Canada’s largest electricity generation source.
When hydroelectricity generation stumbles, as it has over the past two years, there are knock-on effects at the national level that lead to reduced exports and a greater reliance on imports from the United States to meet domestic electricity demand. These factors also tend to increase the use of more carbon-intensive generation sources.
Although electricity exports fall by more than one-quarter, Canada remains a net electricity exporter
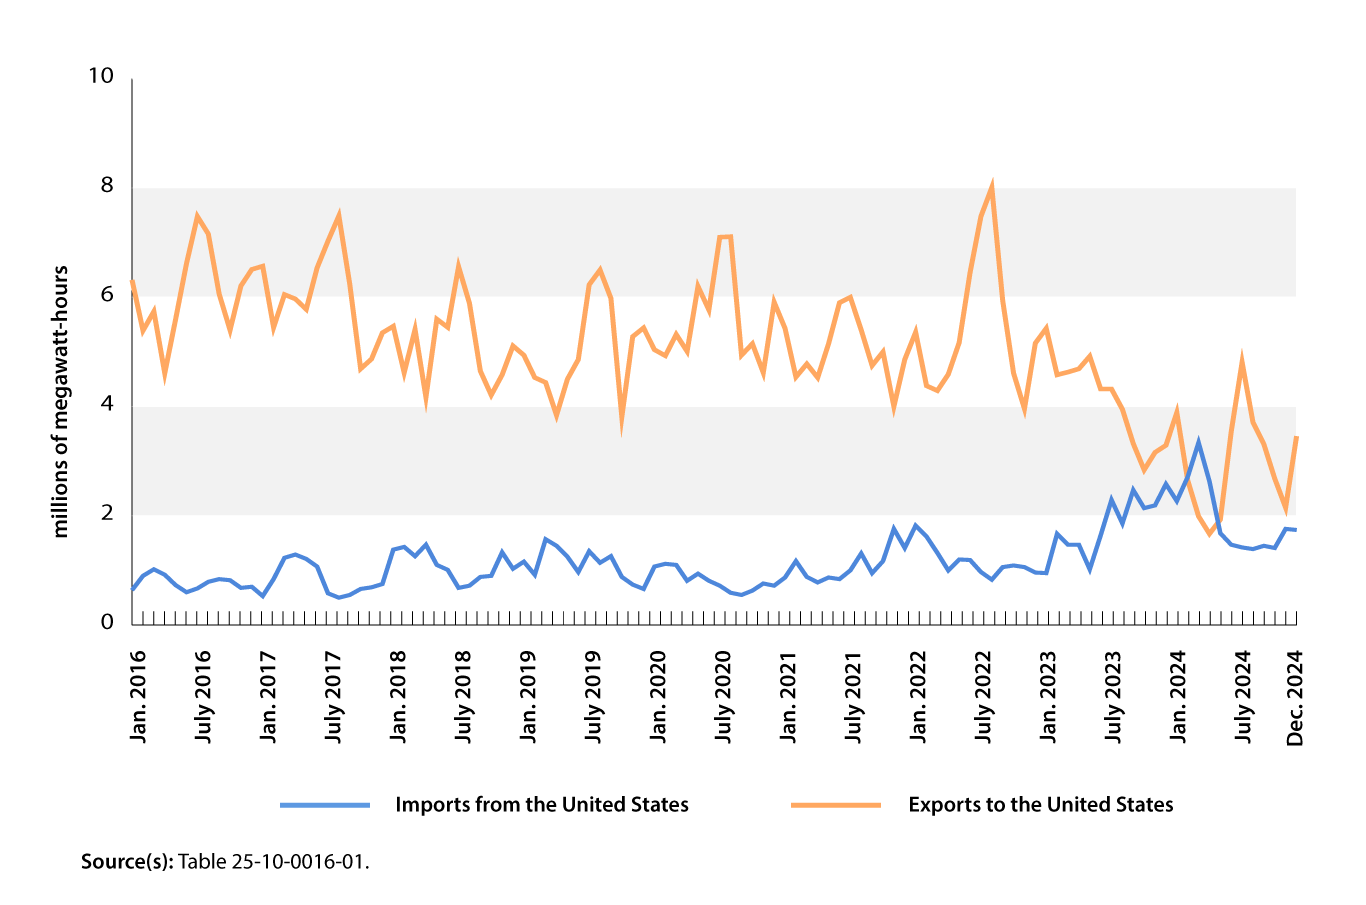
Despite its significant generation capacity, Canada briefly became a net electricity importer during the months of February, March and April 2024, which was one of the most notable electricity stories of the year. This was the first time that imports outweighed exports since this data series was redesigned in 2016, and it happened as many provinces struggled with low hydroelectricity generation due to dry conditions. However, the trend reversed itself, and Canada maintained its position as a net exporter in 2024, though exports remained depressed compared with previous years.
Total Canadian exports of electricity to the United States, Canada’s only electricity trade partner, fell 27.6% year over year to 35.8 million megawatt-hours (MWh) in 2024. For reference, 1 MWh of electricity is roughly equivalent to the power needed to light two 60-watt bulbs for an entire year. Most of the decrease was attributable to Quebec, where exports dropped by more than half (-55.4% to 5.9 million MWh) compared with the previous year. As in 2023, Quebec reduced exports to preserve hydroelectric reservoir levels. For the second consecutive year, Ontario was Canada’s largest exporter in 2024, at 12.5 million MWh, despite recording a 10.1% year-over-year drop in electricity exports. Prior to 2023, Quebec consistently held that title. According to the United States Energy Information Agency, Canada accounted for more than four-fifths (81.9%) of all electricity imports into the United States in 2024.
Canadian electricity imports from the United States peaked at 23.3 million MWh in 2024 (+7.1%). The increase was driven by higher demand in Quebec, which more than tripled (+206.1%), and in Manitoba (+57.7%), two provinces which historically imported very little electricity. Imports to British Columbia fell 14.8% year over year, as drought conditions improved over the course of the year. British Columbia accounted for 61.5% of Canada’s total imports from the United States in 2024.
Chart 1: Canadian electricity imports and exports, 2016 to 2024
Description - Chart 1: Canadian electricity imports and exports, 2016 to 2024
The title of this chart is “Canadian electricity imports and exports, 2016 to 2024.”
This is a line chart. The bottom line represents imports from the United States, and the top line represents exports to the United States.
The vertical axis represents millions of megawatt-hours, from 0 to 10 million megawatt-hours, in increments of 2 million megawatt-hours.
The horizontal axis represents years and months in chronological order from left to right and goes from January 2016 to December 2024.
In January 2016, imports were 0.64 million, and exports were 6.31 million.
In February 2016, imports were 0.90 million, and exports were 5.39 million.
In March 2016, imports were 1.02 million, and exports were 5.74 million.
In April 2016, imports were 0.92 million, and exports were 4.61 million.
In May 2016, imports were 0.73 million, and exports were 0.73 million.
In June 2016, imports were 0.60 million, and exports were 6.62 million.
In July 2016, imports were 0.67 million, and exports were 7.48 million.
In August 2016, imports were 0.79 million, and exports were 7.16 million.
In September 2016, imports were 0.84 million, and exports were 6.06 million.
In October 2016, imports were 0.82 million, and exports were 5.40 million.
In November 2016, imports were 0.68 million, and exports were 6.21 million.
In December 2016, imports were 0.70 million, and exports were 6.51 million.
In January 2017, imports were 0.53 million, and exports were 6.57 million.
In February 2017, imports were 0.84 million, and exports were 5.45 million.
In March 2017, imports were 1.23 million, and exports were 6.05 million.
In April 2017, imports were 1.29 million, and exports were 5.97 million.
In May 2017, imports were 1.21 million, and exports were 5.78 million.
In June 2017, imports were 1.07 million, and exports were 6.54 million.
In July 2017, imports were 0.58 million, and exports were 7.03 million.
In August 2017, imports were 0.50 million, and exports were 7.49 million.
In September 2017, imports were 0.55 million, and exports were 6.24 million.
In October 2017, imports were 0.66 million, and exports were 4.69 million.
In November 2017, imports were 0.69 million, and exports were 4.87 million.
In December 2017, imports were 0.75 million, and exports were 5.35 million.
In January 2018, imports were 1.38 million, and exports were 5.47 million.
In February 2018, imports were 1.43 million, and exports were 4.62 million.
In March 2018, imports were 1.26 million, and exports were 5.41 million.
In April 2018, imports were 1.47 million, and exports were 4.17 million.
In May 2018, imports were 1.10 million, and exports were 5.60 million.
In June 2018, imports were 1.01 million, and exports were 5.45 million.
In July 2018, imports were 0.68 million, and exports were 6.56 million.
In August 2018, imports were 0.72 million, and exports were 5.89 million.
In September 2018, imports were 0.88 million, and exports were 4.65 million.
In October 2018, imports were 0.90 million, and exports were 4.21 million.
In November 2018, imports were 1.33 million, and exports were 4.58 million.
In December 2018, imports were 1.03 million, and exports were 5.11 million.
In January 2019, imports were 1.16 million, and exports were 4.94 million.
In February 2019, imports were 0.92 million, and exports were 4.53 million.
In March 2019, imports were 1.57 million, and exports were 4.44 million.
In April 2019, imports were 1.45 million, and exports were 3.84 million.
In May 2019, imports were 1.25 million, and exports were 4.50 million.
In June 2019, imports were 0.97 million, and exports were 4.86 million.
In July 2019, imports were 1.35 million, and exports were 6.23 million.
In August 2019, imports were 1.14 million, and exports were 6.50 million.
In September 2019, imports were 1.26 million, and exports were 5.98 million.
In October 2019, imports were 0.88 million, and exports were 3.81 million.
In November 2019, imports were 0.74 million, and exports were 5.28 million.
In December 2019, imports were 0.66 million, and exports were 5.44 million.
In January 2020, imports were 1.07 million, and exports were 5.04 million.
In February 2020, imports were 1.12 million, and exports were 4.93 million.
In March 2020, imports were 1.10 million, and exports were 5.32 million.
In April 2020, imports were 0.81 million, and exports were 5.01 million.
In May 2020, imports were 0.94 million, and exports were 6.20 million.
In June 2020, imports were 0.81 million, and exports were 5.77 million.
In July 2020, imports were 0.72 million, and exports were 7.10 million.
In August 2020, imports were 0.59 million, and exports were 7.11 million.
In September 2020, imports were 0.55 million, and exports were 4.94 million.
In October 2020, imports were 0.63 million, and exports were 5.15 million.
In November 2020, imports were 0.76 million, and exports were 4.62 million.
In December 2020, imports were 0.72 million, and exports were 5.91 million.
In January 2021, imports were 0.87 million, and exports were 5.43 million.
In February 2021, imports were 1.17 million, and exports were 4.54 million.
In March 2021, imports were 0.88 million, and exports were 4.78 million.
In April 2021, imports were 0.78 million, and exports were 4.53 million.
In May 2021, imports were 0.87 million, and exports were 5.15 million.
In June 2021, imports were 0.84 million, and exports were 5.90 million.
In July 2021, imports were 1.00 million, and exports were 6.00 million.
In August 2021, imports were 1.31 million, and exports were 5.40 million.
In September 2021, imports were 0.95 million, and exports were 4.75 million.
In October 2021, imports were 1.17 million, and exports were 5.00 million.
In November 2021, imports were 1.76 million, and exports were 4.00 million.
In December 2021, imports were 1.41 million, and exports were 4.86 million.
In January 2022, imports were 1.82 million, and exports were 5.36 million.
In February 2022, imports were 1.62 million, and exports were 4.38 million.
In March 2022, imports were 1.32 million, and exports were 4.29 million.
In April 2022, imports were 1.00 million, and exports were 4.59 million.
In May 2022, imports were 1.20 million, and exports were 5.17 million.
In June 2022, imports were 1.19 million, and exports were 6.45 million.
In July 2022, imports were 0.97 million, and exports were 7.48 million.
In August 2022, imports were 0.83 million, and exports were 8.01 million.
In September 2022, imports were 1.06 million, and exports were 5.94 million.
In October 2022, imports were 1.09 million, and exports were 4.61 million.
In November 2022, imports were 1.06 million, and exports were 3.96 million.
In December 2022, imports were 0.96 million, and exports were 5.16 million.
In January 2023, imports were 0.95 million, and exports were 5.43 million.
In February 2023, imports were 1.67 million, and exports were 4.58 million.
In March 2023, imports were 1.47 million, and exports were 4.63 million.
In April 2023, imports were 1.47 million, and exports were 4.69 million.
In May 2023, imports were 1.02 million, and exports were 4.92 million.
In June 2023, imports were 1.64 million, and exports were 4.32 million.
In July 2023, imports were 2.29 million, and exports were 4.32 million.
In August 2023, imports were 1.86 million, and exports were 3.95 million.
In September 2023, imports were 2.47 million, and exports were 3.32 million.
In October 2023, imports were 2.14 million, and exports were 2.84 million.
In November 2023, imports were 2.19 million, and exports were 3.16 million.
In December 2023, imports were 2.58 million, and exports were 3.29 million.
In January 2024, imports were 2.27 million, and exports were 3.89 million.
In February 2024, imports were 2.71 million, and exports were 2.65 million.
In March 2024, imports were 3.34 million, and exports were 1.99 million.
In April 2024, imports were 2.63 million, and exports were 1.67 million.
In May 2024, imports were 1.68 million, and exports were 1.93 million.
In June 2024, imports were 1.47 million, and exports were 3.54 million.
In July 2024, imports were 1.42 million, and exports were 4.81 million.
In August 2024, imports were 1.39 million, and exports were 3.71 million.
In September 2024, imports were 1.45 million, and exports were 3.31 million.
In October 2024, imports were 1.41 million, and exports were 2.68 million.
In November 2024, imports were 1.76 million, and exports were 2.15 million.
In December 2024, imports were 1.74 million, and exports were 3.45 million.
Source(s): Table 25-10-0016-01.
More than half of Canadian electricity generation continues to come from hydro
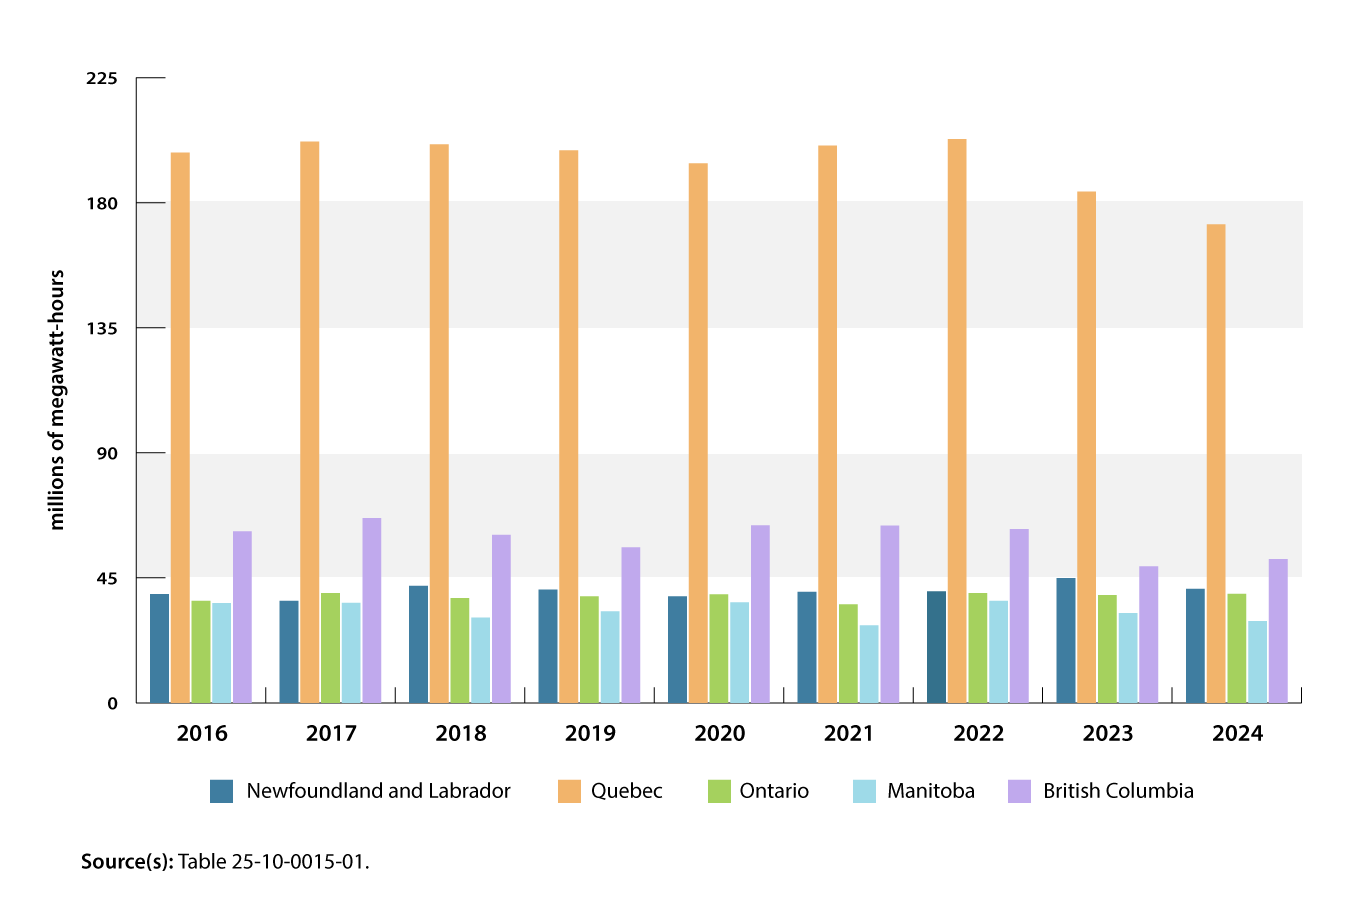
Total electricity generated in Canada was down 0.9% year over year to 609.5 million MWh in 2024. This was the lowest level of generation since this series was redesigned, below the previous series low set in 2023 (615.3 million MWh).
Hydroelectricity generation totalled 341.8 million MWh in 2024, 4.9% lower than in 2023 and 3.5% lower than the five-year average going back to 2019. As 2024 progressed, precipitation levels improved in Western Canada, while expanses of central and eastern Canada saw drought conditions worsen. This led to an increase in hydroelectricity generation in British Columbia (+5.3%) but decreases in Quebec (-6.4%), Newfoundland and Labrador (-8.6%) and Manitoba (-8.9%). Hydroelectricity represented more than half (56.1%) of Canada’s total generation in 2024, but this was its lowest share since the 2016 series redesign.
Chart 2: Hydroelectricity generation by province, 2016 to 2024
Description - Chart 2: Hydroelectricity generation by province, 2016 to 2024
The title of this chart is “Hydroelectricity generation by province, 2016 to 2024.”
This is a vertical bar chart.
The vertical axis represents the generation of hydroelectricity in millions of megawatt-hours, from 0 to 225 million megawatt-hours, in increments of 45 million megawatt-hours.
The horizontal axis represents the years from 2016 to 2024, in chronological order from left to right.
There are five bars for each year: the first bar represents Newfoundland and Labrador, the second bar represents Quebec, the third bar represents Ontario, the fourth bar represents Manitoba and the fifth bar represents British Columbia.
For 2016, the first bar is at 39.12 million, the second bar is at 198.06 million, the third bar is at 36.68 million, the fourth bar is at 35.90 million and the fifth bar is at 61.69 million.
For 2017, the first bar is at 36.72 million, the second bar is at 202.00 million, the third bar is at 39.49 million, the fourth bar is at 35.99 million and the fifth bar is at 66.51 million.
For 2018, the first bar is at 42.11 million, the second bar is at 201.11 million, the third bar is at 37.69 million, the fourth bar is at 30.73 million and the fifth bar is at 60.43 million.
For 2019, the first bar is at 40.74 million, the second bar is at 198.83 million, the third bar is at 38.32 million, the fourth bar is at 32.93 million and the fifth bar is at 55.94 million.
For 2020, the first bar is at 38.32 million, the second bar is at 194.15 million, the third bar is at 39.02 million, the fourth bar is at 36.17 million and the fifth bar is at 63.86 million.
For 2021, the first bar is at 39.97 million, the second bar is at 200.52 million, the third bar is at 35.48 million, the fourth bar is at 27.94 million and the fifth bar is at 63.80 million.
For 2022, the first bar is at 40.16 million, the second bar is at 202.86 million, the third bar is at 39.51 million, the fourth bar is at 36.74 million and the fifth bar is at 62.58 million.
For 2023, the first bar is at 44.94 million, the second bar is at 184.02 million, the third bar is at 38.83 million, the fourth bar is at 32.31 million and the fifth bar is at 49.13 million.
For 2024, the first bar is at 41.07 million, the second bar is at 172.16 million, the third bar is at 39.28 million, the fourth bar is at 29.42 million and the fifth bar is at 51.73 million.
Source(s): Table 25-10-0015-01.
Combustible electricity generation climbs in 2024
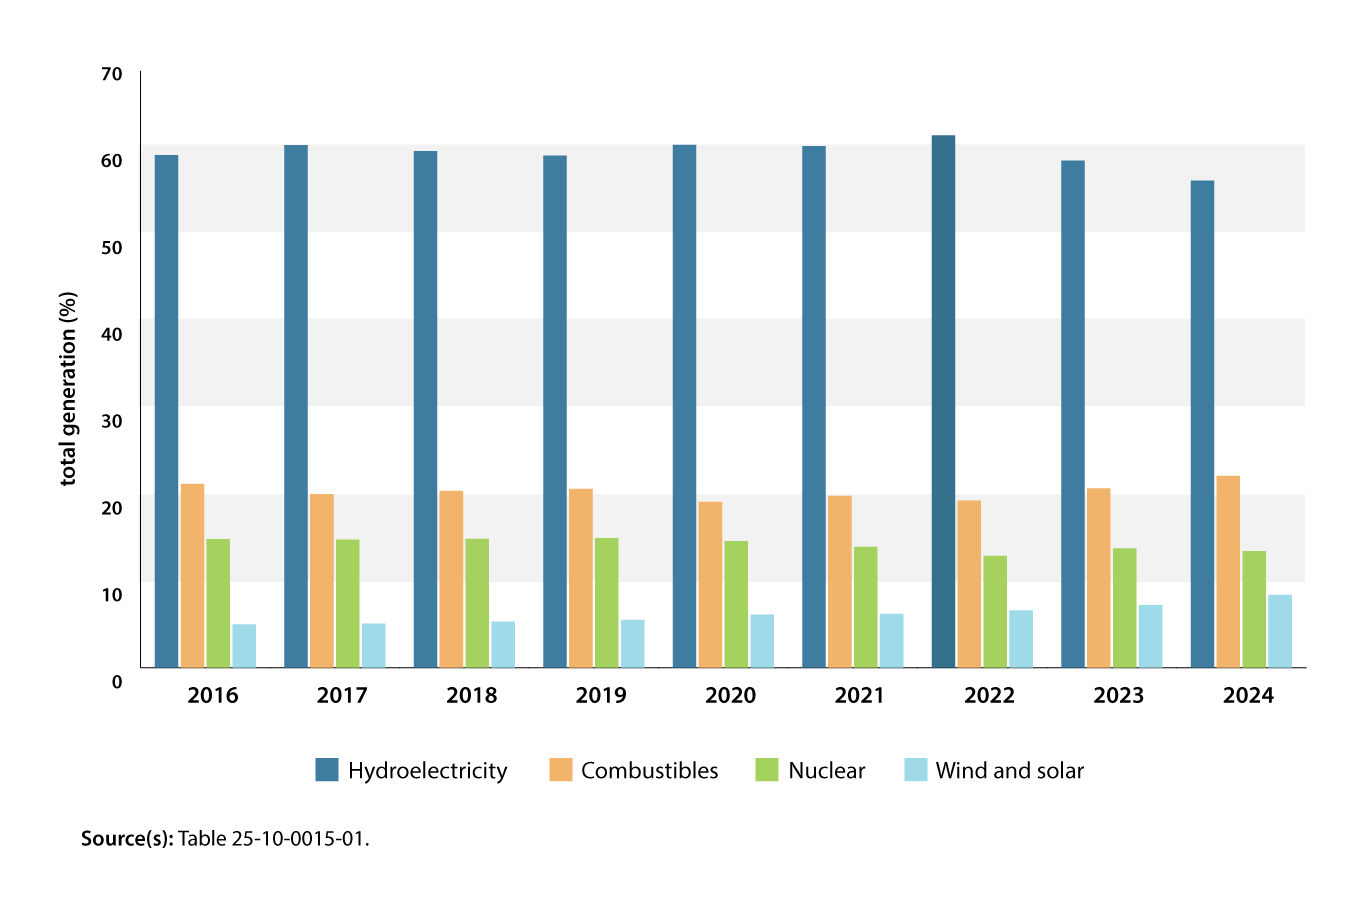
Generation from combustible fuels rose 5.9% year over year to 134.6 million MWh in 2024. Combustible fuels are anything burned to generate electricity, including natural gas, coal, fuel oil, diesel and biomass such as wood. After hydroelectricity, combustibles were Canada’s second-largest generation source, accounting for more than one-fifth (22.1%) of total generation in 2024. While hydroelectricity’s share of total generation fell, combustibles rose to their highest level since the 2016 series redesign.
Nuclear station maintenance drives generation decrease
Nuclear electricity generation declined 3.3% to 81.7 million MWh in 2024. The drop was due to an extended maintenance shutdown at New Brunswick’s Point Lepreau Nuclear Generating Station that lasted most of the year. Nuclear electricity was Canada’s third-largest generation source, clocking in at over one-eighth (13.4%) of total generation. Ontario’s nuclear generation was relatively unchanged year over year (+0.3%), but it was down from levels last seen before the COVID-19 pandemic due to ongoing refurbishment activities, including the rotating shutdown of reactors for maintenance.
Wind and solar continue to grow
Generation from wind rose 15.6% to 45.8 million MWh in 2024, while solar generation rose 12.1% to 5.2 million MWh. While wind and solar together contributed 8.4% of Canada’s total generation mix, they are growing quickly as new facilities continue to be commissioned. In 2024, Alberta recorded a 23.8% year-over-year increase in wind generation and a 21.7% increase in solar, the largest growth in those generation types in Canada.
Chart 3: Canadian electricity generation by type, 2016 to 2024
Description - Chart 3: Canadian electricity generation by type, 2016 to 2024
The title of this chart is “Canadian electricity generation by type, 2016 to 2024.”
This is a vertical bar chart.
The vertical axis represents the percentage of total generation, from 0 to 70%, in increments of 10%.
The horizontal axis represents the years from 2016 to 2024, in chronological order from left to right.
There are four bars for each year. The first bar represents hydroelectricity, the second bar represents combustibles, the third bar represents nuclear and the fourth bar represents wind and solar.
For 2016, the first bar is at 59.01%, the second bar is at 21.16%, the third bar is at 14.81% and the fourth bar is at 4.99%.
For 2017, the first bar is at 60.17%, the second bar is at 19.98%, the third bar is at 14.74% and the fourth bar is at 5.07%.
For 2018, the first bar is at 59.49%, the second bar is at 20.35%, the third bar is at 14.82% and the fourth bar is at 5.31%.
For 2019, the first bar is at 58.97%, the second bar is at 20.59%, the third bar is at 14.91% and the fourth bar is at 5.51%.
For 2020, the first bar is at 60.20%, the second bar is at 19.09%, the third bar is at 14.58% and the fourth bar is at 6.11%.
For 2021, the first bar is at 60.06%, the second bar is at 19.79%, the third bar is at 13.92% and the fourth bar is at 6.20%.
For 2022, the first bar is at 61.30%, the second bar is at 19.22%, the third bar is at 12.86% and the fourth bar is at 6.60%.
For 2023, the first bar is at 58.39%, the second bar is at 20.64%, the third bar is at 13.74% and the fourth bar is at 7.20%.
For 2024, the first bar is at 56.08%, the second bar is at 22.08%, the third bar is at 13.41% and the fourth bar is at 8.38%.
Source(s): Table 25-10-0015-01.
To explore more data on Canadian energy, stay tuned to the Canadian Centre for Energy Information, the High-Frequency Electricity Data: Visualization Tool and the consolidated energy statistics Daily releases.
Other energy 2024-year-in-review articles
Focus on Canada and the United States
On an annual basis, Canada produced a total of 23.7 million terajoules of primary energy in 2024. Almost two-thirds of this energy was exported to the United States, including 100% of electricity and natural gas exports and over 95% of crude oil exports.
For more data and insights on areas touched by the socio-economic relationship between Canada and the United States, see the Focus on Canada and the United States webpage.
📲 Looking for more? Staying informed has never been easier!
Follow the “Energy” subject in the StatsCAN app to receive personalized updates and stay connected with the most recent articles, reports and analyses.
Contact information
For more information, contact the Statistical Information Service (toll-free 1-800-263-1136; 514-283-8300; infostats@statcan.gc.ca) or Media Relations (statcan.mediahotline-ligneinfomedias.statcan@statcan.gc.ca).