


In 2024, the Canadian refined petroleum products sector continued to adapt to the evolving global energy and geopolitical dynamics. Bolstered by strong production and increased demand from foreign markets, refined petroleum products reached new highs for both production and exports.
Continued growth in petroleum refining in 2024
On an annual basis, production of refined petroleum products grew by 1.4% in 2024 and stood 2.1% above the level in 2019, the last year before the COVID-19 pandemic disrupted the sector. Building off the growth in 2023 (+4.2%), production of refined petroleum products hit an all-time monthly high of 10.4 million cubic metres in July 2024. This growth in production was supported by both increases in domestic (+12.1%) and export (+16.9%) demand for refined petroleum products since the lows seen in 2020.
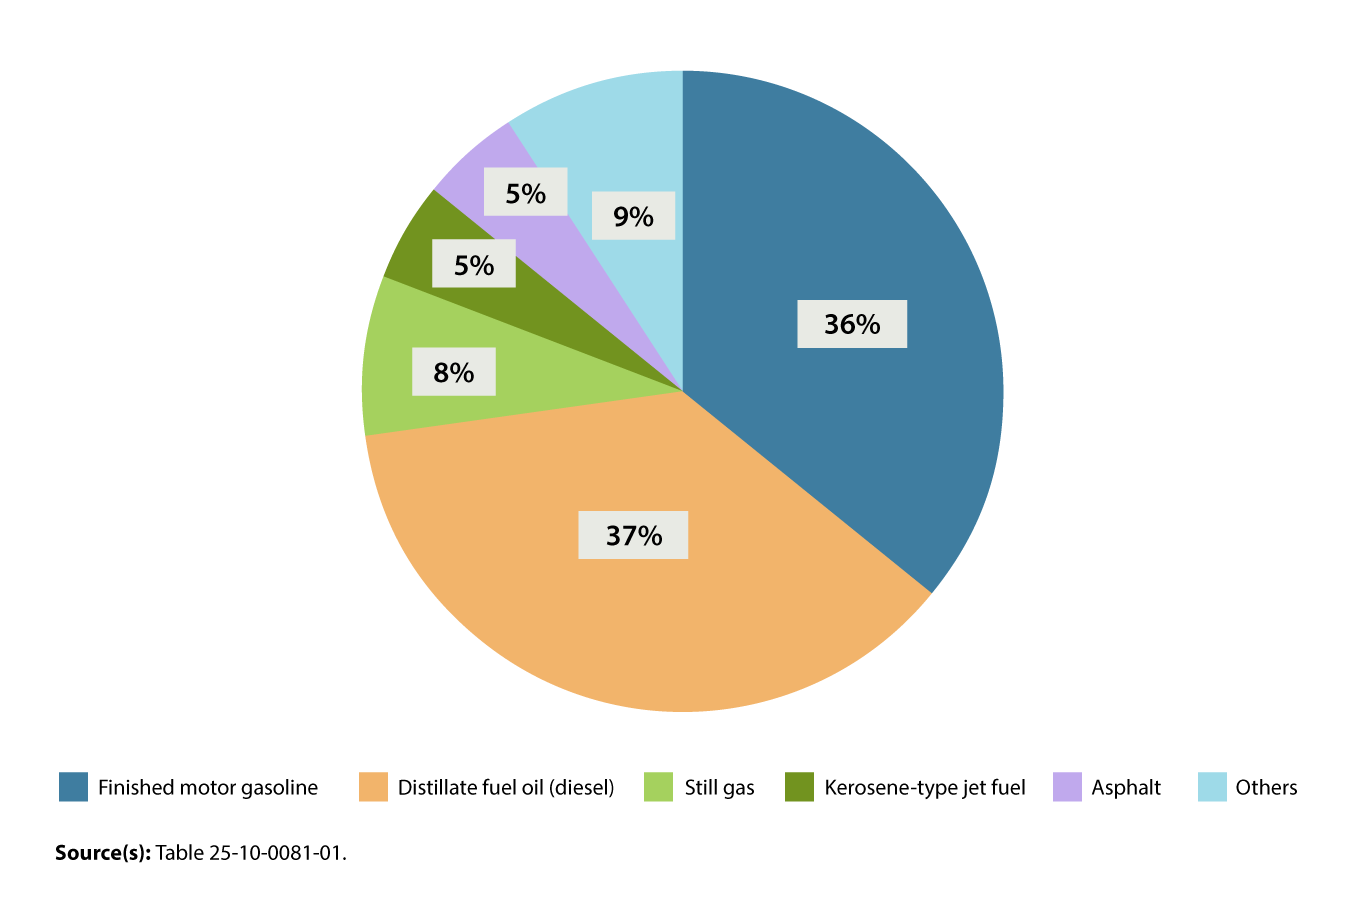
In 2024, finished petroleum products were produced in 17 refineries across Canada. Alberta (30%) accounted for the largest share of refining capacity, followed by Ontario and Quebec (21% each), New Brunswick (17%), Saskatchewan (8%), British Columbia (4%) and Newfoundland and Labrador (1%). The category of finished petroleum products consists of 14 different products, of which five made up over 90% of the total production: distillate fuel oil (diesel) (37%), finished motor gasoline (36%), still gas (a post-refining byproduct, usually consumed as refinery fuel) (8%), kerosene-type jet fuel (5%) and asphalt (5%).
Other petroleum products, including wax and candles, but also various unfinished products such as blending agents, made up the remaining proportion (9%).
Chart 1: Distribution of refined petroleum products, data series average from 2019 to 2024
Description - Chart 1: Distribution of refined petroleum products, data series average from 2019 to 2024
The title of this chart is “Distribution of refined petroleum products, data series average from 2019 to 2024.”
This is a pie chart, representing the data series average production distribution of refined petroleum products from 2019 to 2024.
Distillate fuel oil represents 37% of refined petroleum products.
Finished motor gasoline represents 36% of refined petroleum products.
Others represents 9% of refined petroleum products.
Still gas represents 8% of refined petroleum products.
Kerosene-type jet fuel represents 5% of refined petroleum products.
Asphalt represents 5% of refined petroleum products.
Source(s): Table 25-10-0081-01.
Records for both finished motor gasoline and distillate fuel oil production
Both distillate fuel oil (diesel) (41.6 million cubic metres) and finished motor gasoline (42.2 million cubic metres) saw record production levels in 2024. Year-over-year, distillate fuel oil (diesel) increased 1.7% while finished motor gasoline was up by 1.3%. For both commodities, production levels observed in 2024 represented a gain of approximately 4% each from 2019. Meanwhile, in 2024, domestic consumption of finished motor gasoline declined slightly (-1.4%) compared with 2019, while distillate fuel oil consumption saw a modest increase (+1.9%). Conversely, kerosene-type jet fuel production rose 4.3% from 2023, but was still below the levels recorded in 2019 (-7.2%).
New high for exports of finished petroleum products in 2024
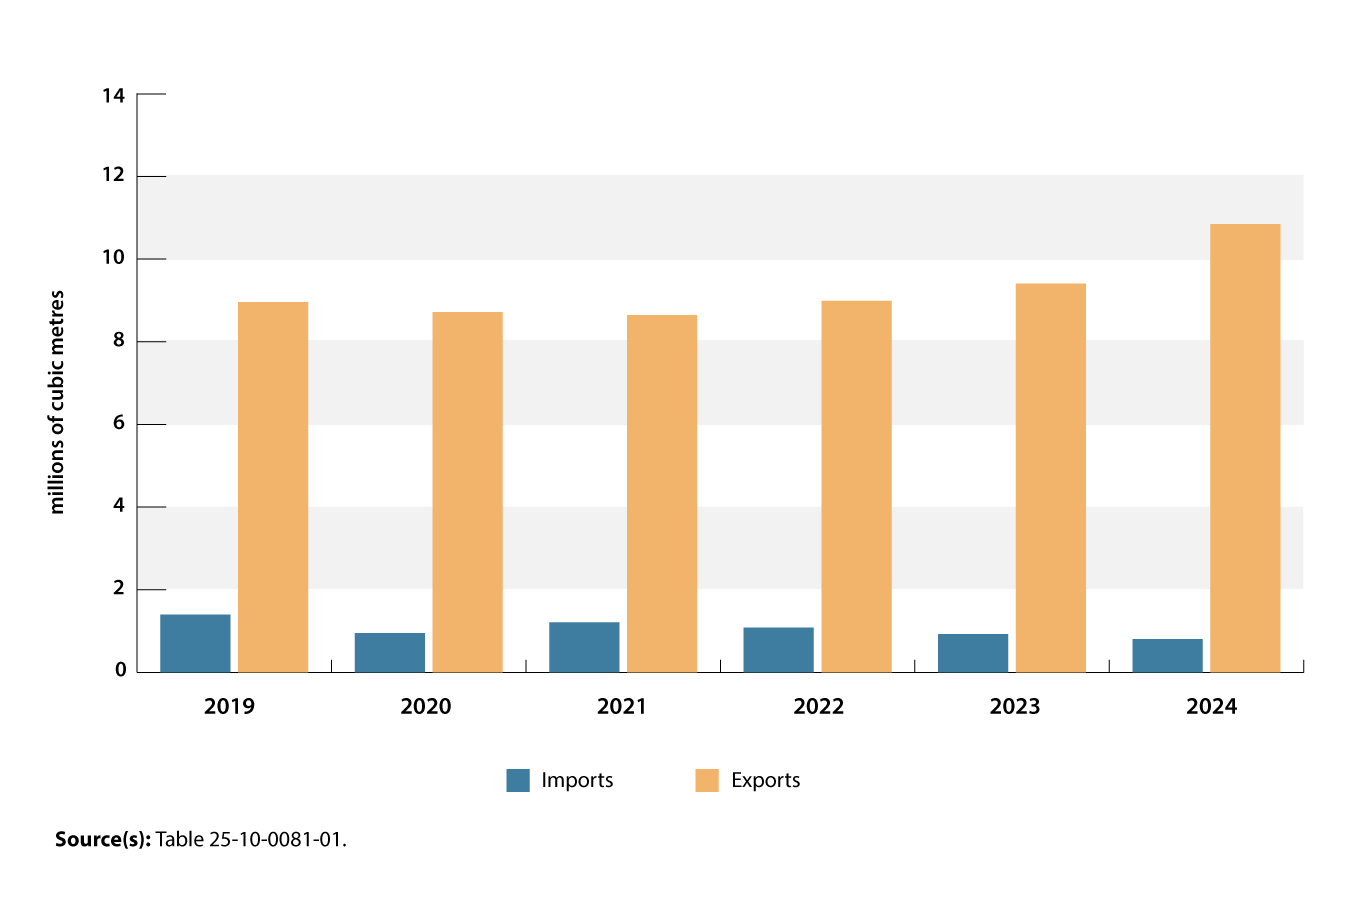
Exports of finished petroleum products hit a new series high of 19.6 million cubic metres in 2024, up 10.5% from 2023. Distillate fuel oil (diesel) exports averaged over 900 000 cubic metres on a monthly basis in 2024, reaching an annual total of 10.8 million cubic metres. Canadian exports of distillate fuel oil in 2024, valued at $4.6 billion, mostly went to the United States and accounted for the largest share of finished petroleum product exports, at 55,4%. This was followed by 6.2 million cubic metres of asphalt, which accounted for 16% of exports.
Chart 2: Distillate fuel oil (diesel), imports and exports
Description - Chart 2: Distillate fuel oil (diesel), imports and exports
The title of the chart is “Distillate fuel oil (diesel) imports and exports.”
This is a grouped bar chart. There are two bars in each group: the first bar represents imports from the United States, and the second bar represents exports to the United States.
The horizontal axis shows the years from 2019 to 2024, from left to right in chronological order.
The vertical axis represents the volume of distillate fuel oil in millions of cubic metres, from 0 to 14, in increments of 2.
In 2019, imports were 1 398 207 cubic metres and exports were 8 957 886 cubic metres.
In 2020, imports were 948 643 cubic metres and exports were 8 716 220 cubic metres.
In 2021, imports were 1 212 007 cubic metres, and exports were 8 643 815 cubic metres.
In 2022, imports were 1 083 328 cubic metres, and exports were 8 988 497 cubic metres.
In 2023, imports were 926 216 cubic metres, and exports were 9 406 671 cubic metres.
In 2024, imports were 802 025 cubic metres, and exports were 10 847 838 cubic metres.
Source(s): Table 25-10-0081-01.
Meanwhile, Canada imported 8.5 million cubic metres of finished petroleum products in 2024, down almost 5.4% from 2023. Kerosene-type jet fuel (31.5% of total imports), finished motor gasoline (20.8%) and petroleum coke (18.2%) were the top three imported fuels in 2024.
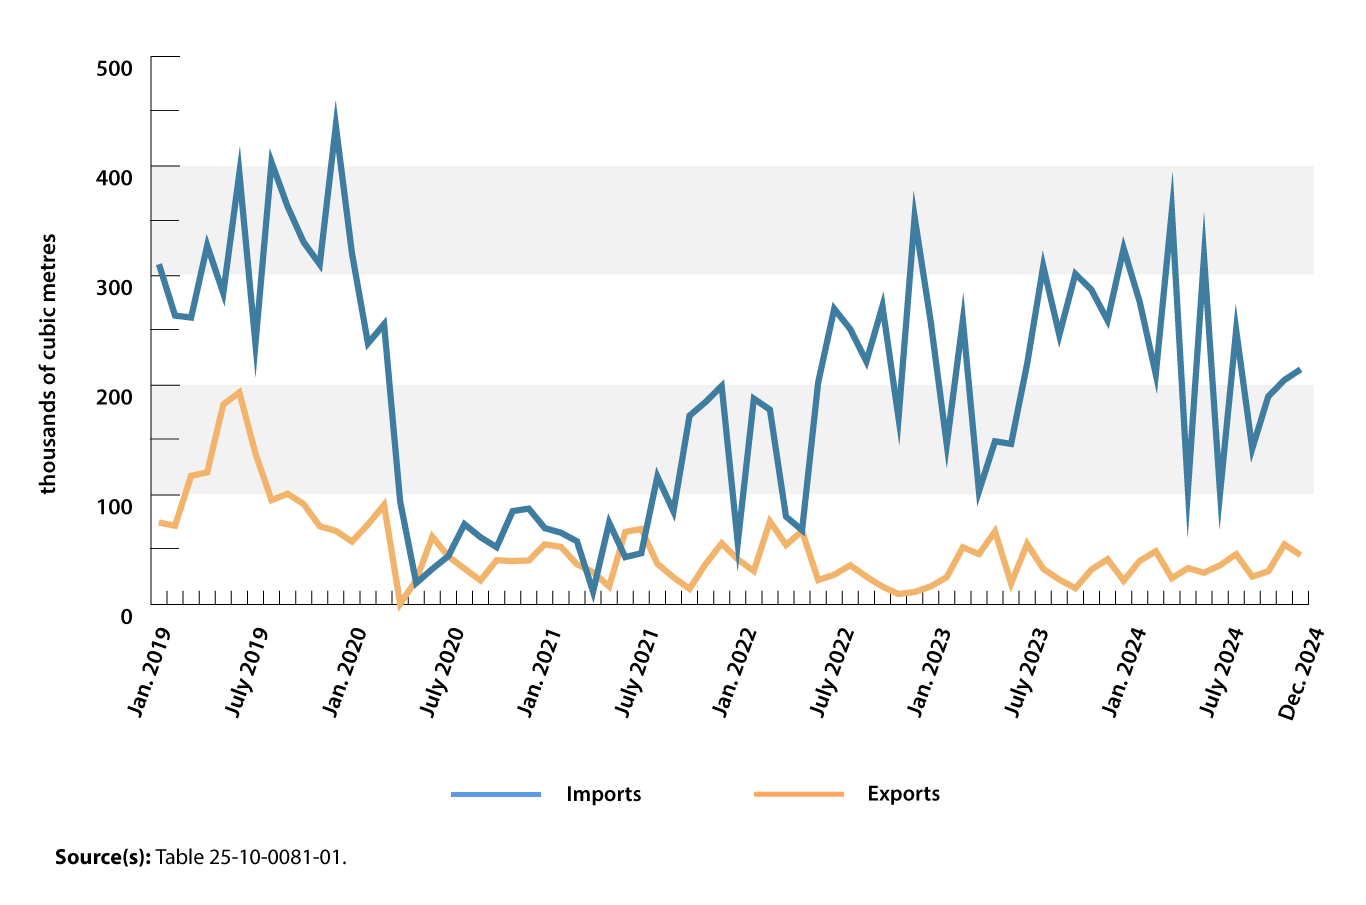
Chart 3: Kerosene-type jet fuel, imports vs. exports
Description - Chart 3: Kerosene-type jet fuel, imports vs. exports
The title of this chart is “Kerosene-type jet fuel imports and exports.”
This is a grouped line chart. The first line represents imports from the United States, and the second line represents exports to the United States.
The horizontal axis represents the months and years, beginning in January 2019 and ending in December 2024, in chronological order from left to right.
The vertical axis represents the volume of kerosene-type jet fuel in thousands of cubic metres, from 0 to 500, in increments of 100.
In January 2020, imports were 320 724, and exports were 57 501.
In February 2020, imports were 238 229, and exports were 73 509.
In March 2020, imports were 255 712, and exports were 90 975.
In April 2020, imports were 94 216, and exports were 727.
In May 2020, imports were 19 655, and exports were 19 655.
In June 2020, imports were 32 513, and exports were 61 889.
In July 2020, imports were 44 283, and exports were 43 961.
In August 2020, imports were 73 336, and exports were 32 799.
In September 2020, imports were 61 425, and exports were 22 058.
In October 2020, imports were 52 361, and exports were 40 478.
In November 2020, imports were 85 246, and exports were 39 724.
In December 2020, imports were 87 532, and exports were 40 216.
In January 2021, imports were 69 711, and exports were 54 967.
In February 2021, imports were 65 629, and exports were 52 681.
In March 2021, imports were 57 733, and exports were 36 749.
In April 2021, imports were 11 827, and exports were 29 623.
In May 2021, imports were 74 743, and exports were 16 514.
In June 2021, imports were 43 311, and exports were 66 284.
In July 2021, imports were 46 837, and exports were 68 965.
In August 2021, imports were 116 851, and exports were 37 245.
In September 2021, imports were 85 024, and exports were 24 960.
In October 2021, imports were 172 288, and exports were 14 391.
In November 2021, imports were 184 802, and exports were 36 953.
In December 2021, imports were 199 337, and exports were 55 842.
In January 2022, imports were 56 363, and exports were 41 226.
In February 2022, imports were 187 845, and exports were 30 664.
In March 2022, imports were 177 776, and exports were 75 956.
In April 2022, imports were 80 251, and exports were 54 447.
In May 2022, imports were 67 931, and exports were 67 007.
In June 2022, imports were 202 464, and exports were 22 423.
In July 2022, imports were 269 696, and exports were 27 265.
In August 2022, imports were 251 199, and exports were 35 923.
In September 2022, imports were 221 735, and exports were 25 481.
In October 2022, imports were 272 291, and exports were 16 406.
In November 2022, imports were 170 168, and exports were 9 635.
In December 2022, imports were 353 493, and exports were 11 487.
In January 2023, imports were 258 133, and exports were 16 627.
In February 2023, imports were 146 011, and exports were 25 083.
In March 2023, imports were 259 346, and exports were 52 237.
In April 2023, imports were 103 382, and exports were 46 122.
In May 2023, imports were 148 961, and exports were 66 709.
In June 2023, imports were 146 558, and exports were 19 250.
In July 2023, imports were 219 701, and exports were 55 322.
In August 2023, imports were 308 644, and exports were 32 659.
In September 2023, imports were 245 899, and exports were 22 830.
In October 2023, imports were 301 602, and exports were 14 943.
In November 2023, imports were 287 002, and exports were 31 946.
In December 2023, imports were 259 245, and exports were 41 347.
In January 2024, imports were 324 901, and exports were 21 778.
In February 2024, imports were 276 178, and exports were 39 886.
In March 2024, imports were 209 967, and exports were 48 667.
In April 2024, imports were 359 132, and exports were 24 041.
In May 2024, imports were 104 655, and exports were 33 341.
In June 2024, imports were 317 392, and exports were 29 037.
In July 2024, imports were 101 883, and exports were 35 914.
In August 2024, imports were 250 334, and exports were 45 978.
In September 2024, imports were 142 369, and exports were 25 508.
In October 2024, imports were 189 982, and exports were 30 416.
In November 2024, imports were 204 819, and exports were 54 872.
In December 2024, imports were 214 487, and exports were 45 199.
Source(s): Table 25-10-0081-01.
Net exports higher in 2024
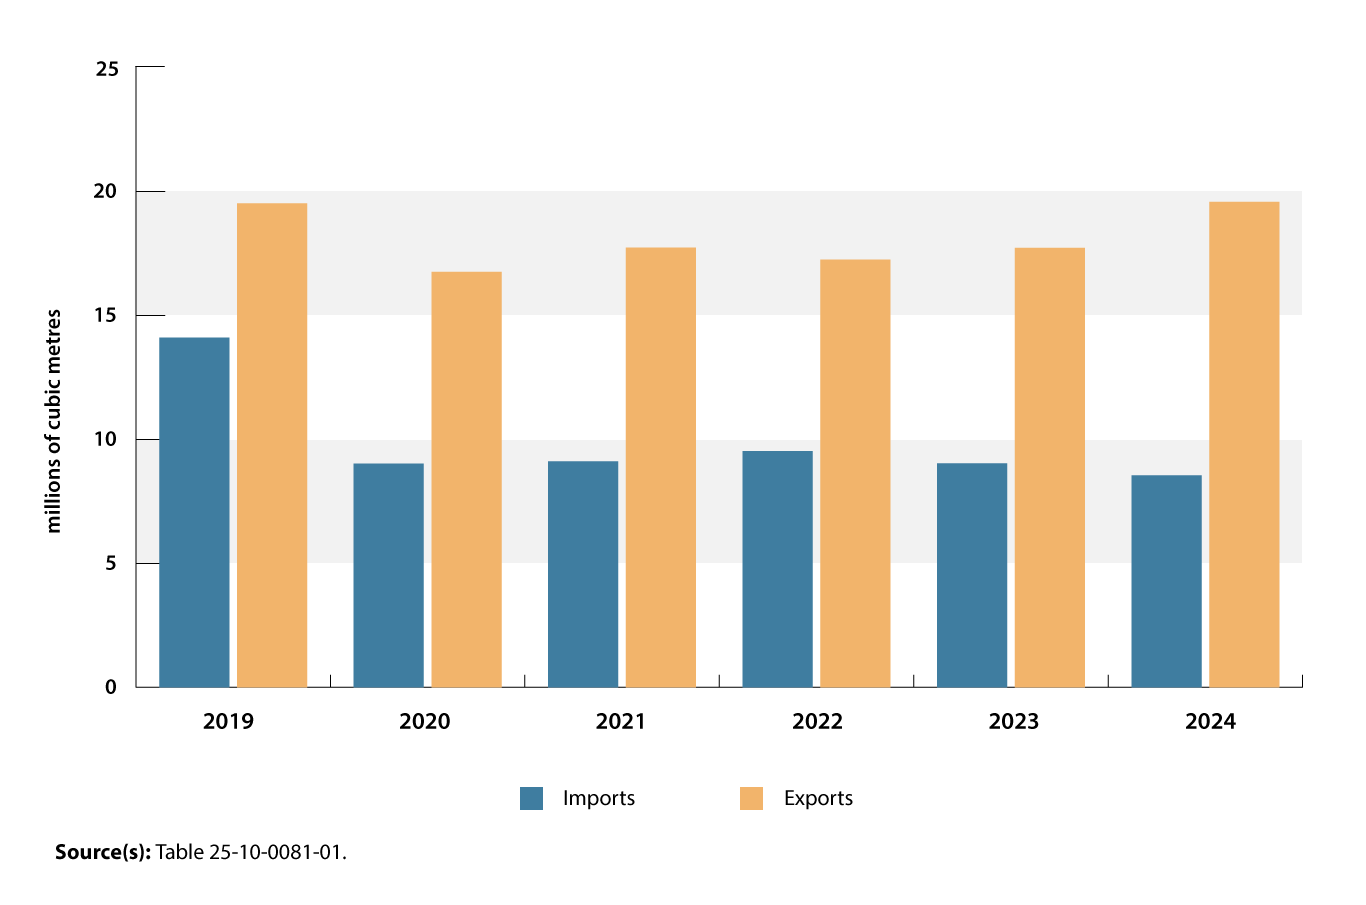
In 2024, Canada exported 10.5% more finished petroleum products and imported 5.4% less than in 2023, improving the overall net exports in 2024. The U.S. Energy Information Administration recently forecasted that US refinery closures and rising consumption will reduce US petroleum inventories, which could mean an increase in demand for Canadian exports in this sector.
Chart 4: Finished petroleum products imports and exports
Description - Chart 4: Finished petroleum products imports and exports
The title of this chart is “Finished petroleum products imports and exports.”
This is a grouped bar chart.
There are two bars in each group: the first bar represents imports from the United States, and the second bar represents exports to the United States.
The vertical axis represents the volume of finished petroleum products in millions of cubic metres, from 0 to 25, in increments of 5.
The horizontal axis shows the years from 2019 to 2024, from left to right in chronological order.
In 2019, imports were 14 107 244 cubic metres, and exports were 19 517 267 cubic metres.
In 2020, imports were 9 021 820 cubic metres, and exports were 16 750 490 cubic metres.
In 2021, imports were 9 111 435 cubic metres, and exports were 17 731 857 cubic metres.
In 2022, imports were 9 530 461 cubic metres, and exports were 17 250 895 cubic metres.
In 2023, imports were 9 033 055 cubic metres, and exports were 17 727 228 cubic metres.
In 2024, imports were 8 547 531 cubic metres, and exports were 19 581 903 cubic metres.
Source(s): Table 25-10-0081-01.
To explore more data on Canadian energy, stay tuned to the Canadian Centre for Energy Information and the consolidated energy statistics Daily releases.
Other energy 2024 year-in-review articles
Focus on Canada and the United States
On an annual basis, Canada produced a total of 23.7 million terajoules of primary energy in 2024. Almost two-thirds of this energy was exported to the United States, including 100% of electricity and natural gas exports and over 95% of crude oil exports.
Looking forward, Statistics Canada will continue to monitor crude oil production and exports.
For more data and insights on areas touched by the socio-economic relationship between Canada and the United States, see the Focus on Canada and the United States webpage.
📲 Looking for more? Staying informed has never been easier!
Follow the “Energy” subject in the StatsCAN app to receive personalized updates and stay connected with the most recent articles, reports and analyses.
Contact information
For more information, contact the Statistical Information Service (toll-free 1-800-263-1136; 514-283-8300; infostats@statcan.gc.ca) or Media Relations (statcan.mediahotline-ligneinfomedias.statcan@statcan.gc.ca).