

The natural gas sector in Canada saw record gains across several key indicators in 2024. Canadian production of natural gas reached a series high of 8.0 billion gigajoules, an increase of 2.3% from the previous year. Exports of natural gas to the United States increased 6.7% year over year to 3.5 billion gigajoules, while total domestic demand for natural gas climbed 5.4% to 5.2 billion gigajoules.
British Columbia propels Canadian production of natural gas in 2024
Most of the increase in production of natural gas in Canada in 2024 was driven by growth in British Columbia (+7.0%), while Alberta remained largely unchanged (-0.1%). Together, these provinces accounted for almost all (98.9%) natural gas production in Canada. The increase in British Columbia marked the fifth consecutive year-over-year increase in that province, where production has been steadily rising since the start of the series in 2016. The most recent increases in production coincide with the anticipated opening of Canada’s first liquified natural gas export facility in Kitimat, British Columbia, later in 2025.
Total natural gas demand rises despite dips in residential and commercial sectors
Domestic demand for natural gas in 2024 rose 5.4% from the previous year to a series high of 5.2 billion gigajoules. This growth was mainly driven by increased demand from industrial consumers (+7.7%) as this sector accounted for over three-quarters (77.4%) of gas consumed across the country. Industrial deliveries of natural gas in Alberta accounted for more than two-thirds (67.2%) of this total, as it is a key input in oil sands operations.
In 2024, residential consumption of natural gas fell to 607.5 million gigajoules (-0.8%), while commercial consumption fell to 558.8 million gigajoules (-3.0%). The reduced demand in these sectors was due to warmer-than-usual temperatures at the beginning of 2024. According to a report from Environment and Climate Change Canada, the national average temperature for the winter season (December 2023 to February 2024) in 2023/2024 was 5.2°C above the baseline average (defined as the mean over the 1961-to-1990 reference period).
Chart 1: Marketable production and industrial consumption of natural gas
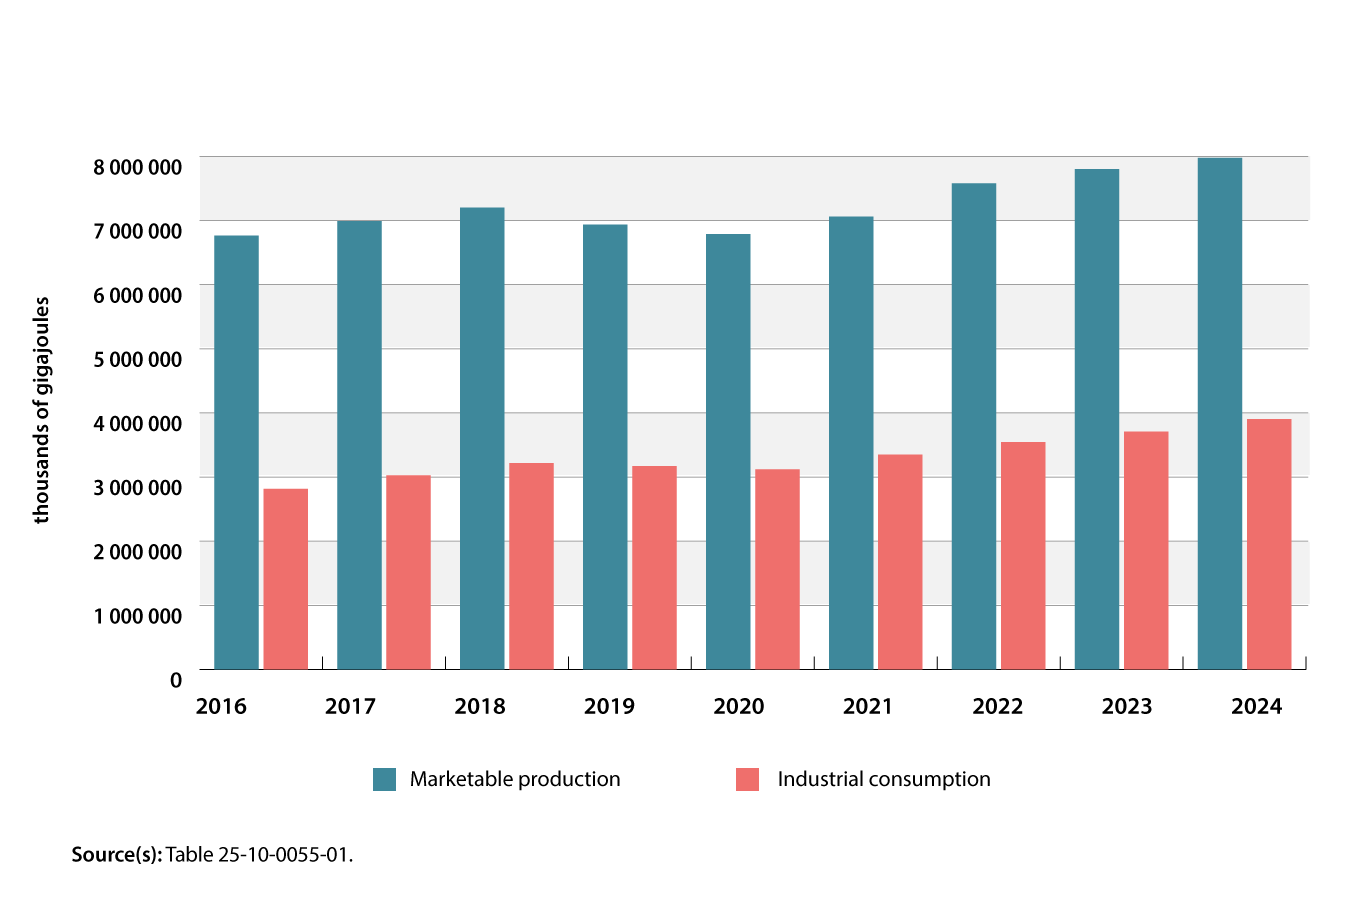
Description - Chart 1: Marketable production and industrial consumption of natural gas
The title of this chart is “Marketable production and industrial consumption of natural gas.”
This is a vertical bar chart.
The vertical axis shows volumes of natural gas in thousands of gigajoules from 0 to 8 000 000, in increments of 1 000 000.
The horizontal axis shows the years from 2016 to 2024, in chronological order from left to right.
There are two bars for each year. The first bar represents marketable production, and the second bar represents industrial consumption.
In 2016, marketable production was 6 764 677 thousand gigajoules, and industrial consumption was 2 814 216 thousand gigajoules.
In 2017, marketable production was 6 992 249 thousand gigajoules, and industrial consumption was 2 026 825 thousand gigajoules.
In 2018, marketable production was 7 202 178 thousand gigajoules, and industrial consumption was 2 217 764 thousand gigajoules.
In 2019, marketable production was 6 937 904 thousand gigajoules, and industrial consumption was 3 170 035 thousand gigajoules.
In 2020, marketable production was 6 788 294 thousand gigajoules, and industrial consumption was 3 120 389 thousand gigajoules.
In 2021, marketable production was 7 060 125 thousand gigajoules, and industrial consumption was 3 351 350 thousand gigajoules.
In 2022, marketable production was 7 578 140 thousand gigajoules, and industrial consumption was 3 544 705 thousand gigajoules.
In 2023, marketable production was 7 800 780 thousand gigajoules, and industrial consumption was 3 708 935 thousand gigajoules.
In 2024, marketable production was 7 978 834 thousand gigajoules, and industrial consumption was 3 995 695 thousand gigajoules.
Source(s): Table 25-10-0055-01.
Natural gas prices fall to the lowest levels in more than 40 years
Increased production by domestic producers in anticipation of the new liquified natural gas export terminal, combined with elevated storage levels and reduced demand during the winter, resulted in a supply glut that caused prices to plummet in the second half of 2024. Average natural gas prices dropped 21.3% from 2023, compounding a significant decrease from the previous year. According to the Raw Materials Price Index, natural gas prices in September 2024 fell 33.4% year over year, to the lowest level since the beginning of the series in 1981.
In addition to higher production levels, reduced demand in both Canada and the United States due to warmer temperatures caused inventories of natural gas to remain elevated in 2024. Closing inventories were consistently high throughout the year, posting seven consecutive months above the one-billion mark, and peaking at a series high of 1.2 billion gigajoules in October. This eclipsed the previous record set in the same month of 2023.
Chart 2: Closing inventories in Canada
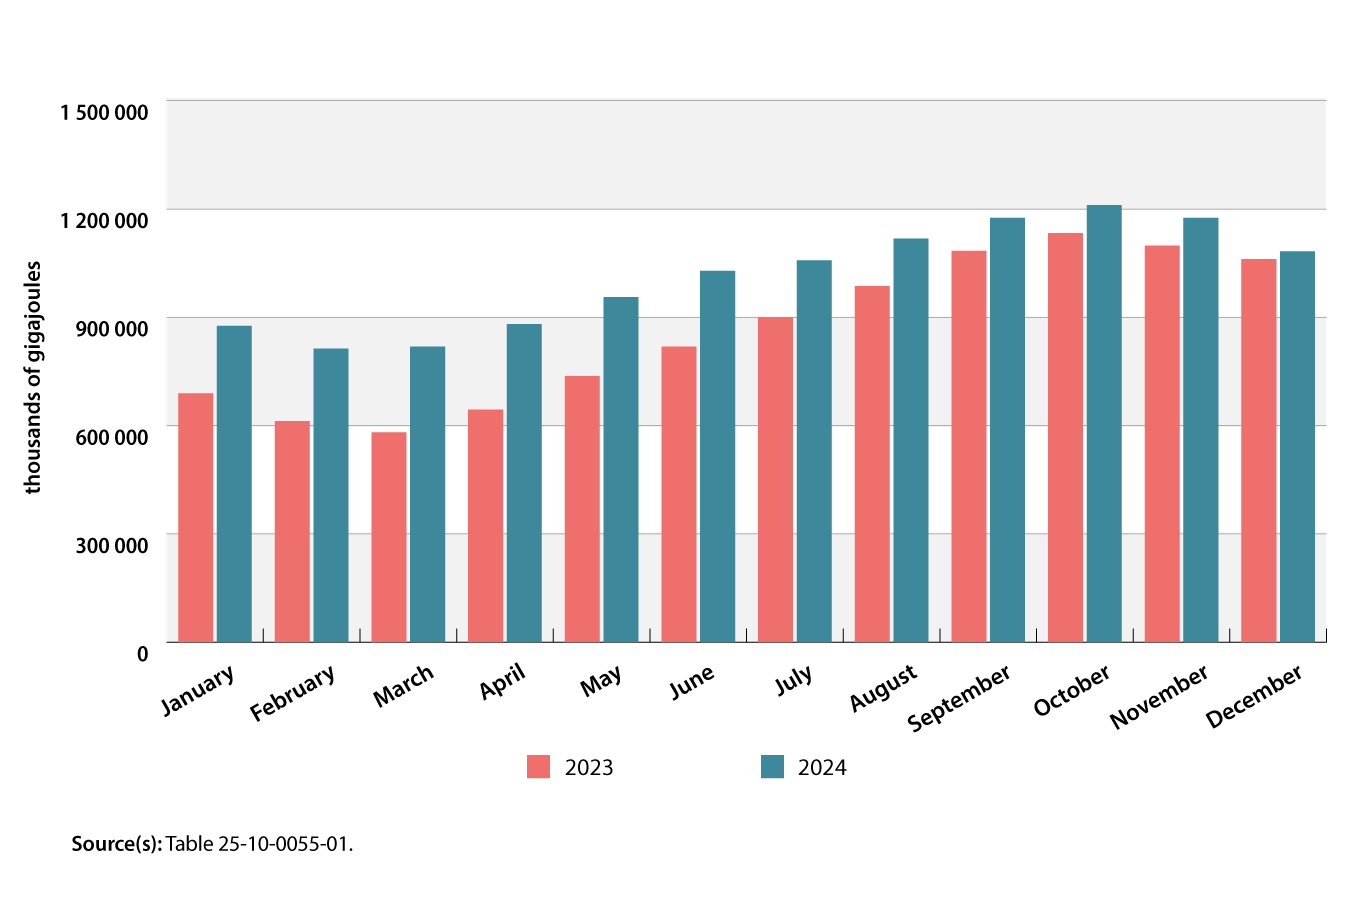
Description - Chart 2: Closing inventories in Canada
The title of this chart is “Closing inventories in Canada.”
This is a vertical bar chart.
The vertical axis represents thousands of gigajoules of natural gas in storage, from 0 to 1 500 000, in increments of 300 000.
The horizontal axis represents all the months from January to December, in chronological order from left to right.
There are two bars for each month, the first bar representing 2023, and the second bar representing 2024.
In January, closing inventories were 689 443.5 thousand gigajoules in 2023, and 876 355.5 thousand gigajoules in 2024.
In February, closing inventories were at 612 237.6 thousand gigajoules in 2023, and at 813 557.1 thousand gigajoules in 2024.
In March, closing inventories were at 581 053.0 thousand gigajoules in 2023, and at 819 120.3 thousand gigajoules in 2024.
In April, closing inventories were at 643 933.8 thousand gigajoules in 2023, and at 881 114.8 thousand gigajoules in 2024.
In May, closing inventories were at 736 874.4 thousand gigajoules in 2023, and at 955 768.5 thousand gigajoules in 2024.
In June, closing inventories were at 818 585.1 thousand gigajoules in 2023, and at 1 028 459.8 thousand gigajoules in 2024.
In July, closing inventories were at 898 236.8 thousand gigajoules in 2023, and at 1 057 978.7 thousand gigajoules in 2024.
In August, closing inventories were at 986 687.8 thousand gigajoules in 2023, and at 1 117 719.0 thousand gigajoules in 2024.
In September, closing inventories were at 1 084 092.6 thousand gigajoules in 2023, and at 1 175 169.4 thousand gigajoules in 2024.
In October, closing inventories were at 1 132 929.4 thousand gigajoules in 2023, and at 1 210 901.9 thousand gigajoules in 2024.
In November, closing inventories were at 1 098 843.4 thousand gigajoules in 2023, and at 1 175 293.1 thousand gigajoules in 2024.
For December, closing inventories were at 1 061 149.3 thousand gigajoules in 2023, and at 1 082 708.9 thousand gigajoules in 2024.
Source(s): Table 25-10-0055-01.
Exports of natural gas to US markets rose 6.7% year over year to 3.5 billion gigajoules in 2024. This increase followed a 2.9% dip in 2023, which was due in large part to an expansion in production capacity coupled with weaker demand in the United States.
To explore more data on Canadian natural gas, stay tuned to the Canadian Centre for Energy Information’s natural gas dashboard. To follow natural gas data throughout the year, keep an eye on the monthly Energy Statistics releases in The Daily.
Other energy 2024-year-in-review articles
Focus on Canada and the United States
On an annual basis, Canada produced a total of 23.7 million terajoules of primary energy in 2024. Almost two-thirds of this energy was exported to the United States, including 100% of natural gas and electricity exports and over 95% of crude oil.
For more data and insights on areas touched by the socio-economic relationship between Canada and the United States, see the Focus on Canada and the United States webpage.
📲 Looking for more? Staying informed has never been easier!
Follow the “Energy” subject in the StatsCAN app to receive personalized updates and stay connected with the most recent articles, reports and analyses.
Contact information
For more information, contact the Statistical Information Service (toll-free 1-800-263-1136; 514-283-8300; infostats@statcan.gc.ca) or Media Relations (statcan.mediahotline-ligneinfomedias.statcan@statcan.gc.ca).