

Job vacancies decrease in the first quarter of 2025
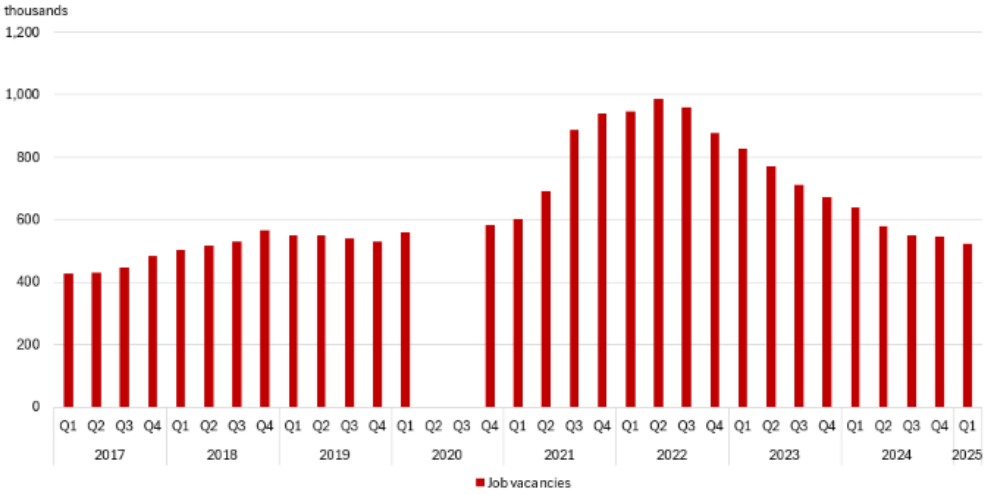
Job vacancies fell in the first quarter of 2025 to 524,300 (-20,600; -3.8%), following little change in the fourth quarter of 2024. Year over year, job vacancies were down by 116,100 (-18.1%) in the first quarter of 2025. The number of vacancies in the first quarter was comparable to the pre-COVID-19 pandemic average of 506,300 recorded from 2017 to 2019.
Job vacancies fell for both full-time (-14,000; -3.4%) and part-time (-6,600; -5.0%) positions in the first quarter of 2025. Permanent positions (-18,000; -4.0%) also fell in the first quarter of 2025, while temporary positions saw little change.
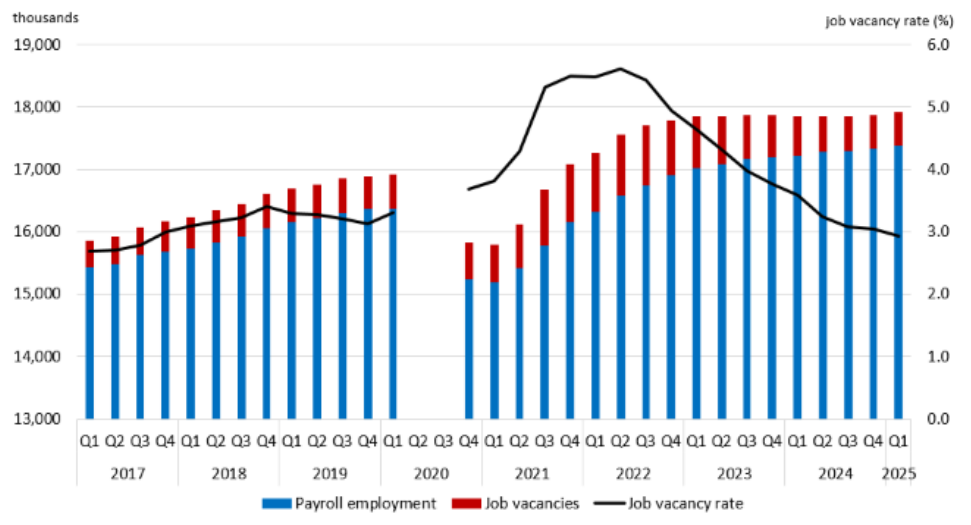
Despite the decrease in job vacancies, total labour demand (the sum of filled and vacant positions) rose by 42,200 (+0.2%) in the first quarter of 2025, due to an increase in payroll employment (+62,800; +0.4%).
The job vacancy rate—which corresponds to the number of vacant positions as a proportion of total labour demand—fell by 0.1 percentage points to 2.9% in the first quarter. On a year-over-year basis, the job vacancy rate was down 0.7 percentage points.
Chart 1: Job vacancies fall in the first quarter
Description - Chart 1
This is a bar chart.
The vertical axis on the left shows the number of job vacancies by increments of 200. It starts at 0 and ends at 1,200.
The horizontal axis shows each quarter, from the first quarter of 2017 to the first quarter of 2025.
The dark red bar represents the number of job vacancies (in thousands) in the last 33 quarters, with 426.7 in the first quarter of 2017, 430.4 in the second quarter of 2017, 448.3 in the third quarter of 2017, 484.8 in the fourth quarter of 2017, 501.5 in the first quarter of 2018, 517.0 in the second quarter of 2018, 531.2 in the third quarter of 2018, 565.9 in the fourth quarter of 2018, 550.6 in the first quarter of 2019, 548.8 in the second quarter of 2019, 541.1 in the third quarter of 2019, 529.7 in the fourth quarter of 2019, 560.0 in the first quarter of 2020, second and third quarters of 2020 omitted because data were not collected during this phase of the COVID-19 pandemic, 583.3 in the fourth quarter of 2020, 601.6 in the first quarter of 2021, 691.4 in the second quarter of 2021, 885.4 in the third quarter of 2021, 938.4 in the fourth quarter of 2021, 945.5 in the first quarter of 2022, 985.9 in the second quarter of 2022, 961.2 in the third quarter of 2022, 878.0 in the fourth quarter of 2022, 828.6 in the first quarter of 2023, 772.1 in the second quarter of 2023, 710.8 in the third quarter of 2023, 671.8 in the fourth quarter of 2023, 640.3 in the first quarter of 2024, 578.7 in the second quarter of 2024, 548.8 in the third quarter of 2024, 544.9 in the fourth quarter of 2024, and 524.3 in the first quarter of 2025.
Notes: Job Vacancy and Wage Survey data collection was suspended for the second and third quarters of 2020. Therefore, data for these reference periods are not available. Data are seasonally adjusted. Q = quarter.
Sources: Job Vacancy and Wage Survey (5217), table 14-10-0400-01.
Chart 2: Job vacancies decreases while total labour demand increases
Description - Chart 2
This is a linear and bar combination chart.
The vertical axis on the left shows the number of job vacancies and number of payroll employment in thousands, by increments of 1,000. It starts at 13,000 and ends at 19,000.
The vertical axis on the right shows the job vacancy rate by percentage, by increments of 1 percentage point. It starts at 0.0 and ends at 6.0.
The horizontal axis shows each quarter, from the first quarter of 2017 to the first quarter of 2025.
The dark red bar represents the number of job vacancies (in thousands) in the last 33 quarters, with 426.7 in the first quarter of 2017, 430.4 in the second quarter of 2017, 448.3 in the third quarter of 2017, 484.8 in the fourth quarter of 2017, 501.5 in the first quarter of 2018, 517.0 in the second quarter of 2018, 531.2 in the third quarter of 2018, 565.9 in the fourth quarter of 2018, 550.6 in the first quarter of 2019, 548.8 in the second quarter of 2019, 541.1 in the third quarter of 2019, 529.7 in the fourth quarter of 2019, 560.0 in the first quarter of 2020, second and third quarters of 2020 omitted because data were not collected during this phase of the COVID-19 pandemic, 583.3 in the fourth quarter of 2020, 601.6 in the first quarter of 2021, 691.4 in the second quarter of 2021, 885.4 in the third quarter of 2021, 938.4 in the fourth quarter of 2021, 945.5 in the first quarter of 2022, 985.9 in the second quarter of 2022, 961.2 in the third quarter of 2022, 878.0 in the fourth quarter of 2022, 828.6 in the first quarter of 2023, 772.1 in the second quarter of 2023, 710.8 in the third quarter of 2023, 671.8 in the fourth quarter of 2023, 640.3 in the first quarter of 2024, 578.7 in the second quarter of 2024, 548.8 in the third quarter of 2024, 544.9 in the fourth quarter of 2024, and 524.3 in the first quarter of 2025.
The blue bar represents the payroll employment (in thousands) in the last 33 quarters, with 15,438.4 in the first quarter of 2017, 15,487.7 in the second quarter of 2017, 15,628.0 in the third quarter of 2017, 15,686.7 in the fourth quarter of 2017, 15,730.0 in the first quarter of 2018, 15,835.3 in the second quarter of 2018, 15,921.7 in the third quarter of 2018, 16,051.7 in the fourth quarter of 2018, 16,149.0 in the first quarter of 2019, 16,215.5 in the second quarter of 2019, 16,308.5 in the third quarter of 2019, 16,366.1 in the fourth quarter of 2019, 16,365.2 in the first quarter of 2020, second and third quarters of 2020 omitted because data were not collected during this phase of the COVID-19 pandemic, 15,238.2 in the fourth quarter of 2020, 15,188.7 in the first quarter of 2021, 15,422.6 in the second quarter of 2021, 15,786.3 in the third quarter of 2021, 16,153.1 in the fourth quarter of 2021, 16,317.9 in the first quarter of 2022, 16,573.2 in the second quarter of 2022, 16,750.0 in the third quarter of 2022, 16,903.9 in the fourth quarter of 2022, 17,022.1 in the first quarter of 2023, 17,081.8 in the second quarter of 2023, 17,164.5 in the third quarter of 2023, 17,196.8 in the fourth quarter of 2023, 17,212.1 in the first quarter of 2024, 17,276.3 in the second quarter of 2024, 17,301.3 in the third quarter of 2024, 17,323.9 in the fourth quarter of 2024, and 17,386.7 in the first quarter of 2025.
The black line represents the job vacancy rate (in percentage) in the last 33 quarters, with 2.7% in the first quarter of 2017, 2.7% in the second quarter of 2017, 2.8% in the third quarter of 2017, 3.0% in the fourth quarter of 2017, 3.1% in the first quarter of 2018, 3.2% in the second quarter of 2018, 3.2% in the third quarter of 2018, 3.4% in the fourth quarter of 2018, 3.3% in the first quarter of 2019, 3.3% in the second quarter of 2019, 3.2% in the third quarter of 2019, 3.1% in the fourth quarter of 2019, 3.3% in the first quarter of 2020, second and third quarters of 2020 omitted because data were not collected during this phase of the COVID-19 pandemic, 3.7% in the fourth quarter of 2020, 3.8% in the first quarter of 2021, 4.3% in the second quarter of 2021, 5.3% in the third quarter of 2021, 5.5% in the fourth quarter of 2021, 5.5% in the first quarter of 2022, 5.6% in the second quarter of 2022, 5.4% in the third quarter of 2022, 4.9% in the fourth quarter of 2022, 4.6% in the first quarter of 2023, 4.3% in the second quarter of 2023, 4.0% in the third quarter of 2023, 3.8% in the fourth quarter of 2023, 3.6% in the first quarter of 2024, 3.2% in the second quarter of 2024, 3.1% in the third quarter of 2024, 3.0% in the fourth quarter of 2024, and 2.9% in the first quarter of 2025.
Notes: Total labour demand is equal to the sum of payroll employment and job vacancies. Job Vacancy and Wage Survey data collection was suspended for the second and third quarters of 2020. Therefore, data for these reference periods are not available. Data are seasonally adjusted. Q = quarter.
Sources: Job Vacancy and Wage Survey (5217), table 14-10-0400-01.
Unemployment-to-job vacancy ratio increases
The unemployment-to-job vacancy ratio—the number of unemployed persons per job vacancy—rose to 2.9 in the first quarter of 2025, compared with 2.8 in the fourth quarter of 2024 and 2.0 in the first quarter of 2024. An increase in the number of unemployed persons (+200,900; +15.6%, as measured by the Labour Force Survey) combined with a decrease in job vacancies (-115,200; -18.1%, excluding territories) contributed to the year-over-year increase in the ratio recorded in the first quarter of 2025.
Job vacancies down in six broad occupational groups
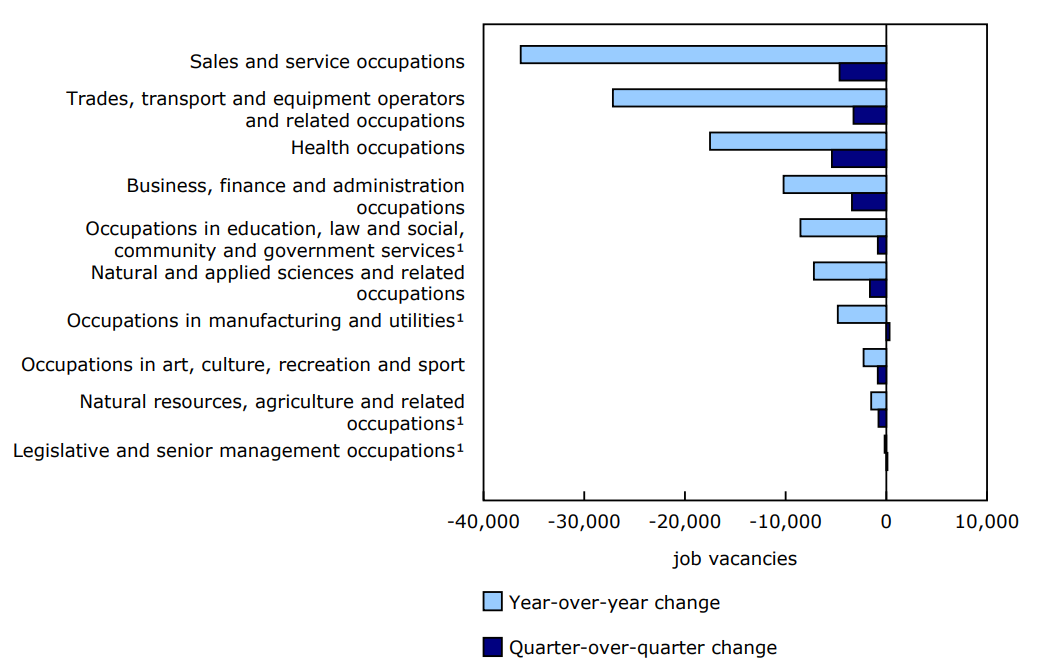
In the first quarter of 2025, decreases in job vacancies were recorded in six broad occupational groups: health occupations (-5,400; -6.7%); sales and service occupations (-4,600; -3.0%); business, finance and administration occupations (-3,400; -4.7%); trades, transport and equipment operators and related occupations (-3,300; -3.2%); natural and applied sciences and related occupations (-1,600; -3.9%); and occupations in art, culture, recreation and sport (-900; -8.2%). Vacancies were little changed in the remaining four broad occupational groups.
On a year-over-year basis, the number of job vacancies was down in all 10 broad occupational groups in the first quarter, led by sales and service occupations (-36,300; -19.6%), trades, transport and equipment operators and related occupations (-27,200; -21.8%), and health occupations (-17,500; -18.9%).
Year over year, the proportion of long-term vacancies—vacancies for which recruitment efforts have been ongoing for 90 days or more—was down in 7 of the 10 broad occupational groups in the first quarter. The largest decreases were in legislative and senior management occupations (-10.0 percentage points to 16.0%), health occupations (-7.1 percentage points to 48.6%), and occupations in manufacturing and utilities (-6.6 percentage points to 24.1%) (not seasonally adjusted).
Chart 3: Job vacancies down year over year in all 10 broad occupational groups
Description - Chart 3
Data table: Job vacancies down year over year in all 10 broad occupational groups
Note: Data are adjusted for seasonality.
1. Quarter-over-quarter changes are not statistically significant.
Sources: Job Vacancy and Wage Survey (5217), table 14-10-0399-01.
Vacancies in health occupations resume decline
Job vacancies in health occupations fell by 5,400 (-6.7%) to 75,100 in the first quarter, following little change in the fourth quarter of 2024.
Year over year, vacancies in health occupations were down by 17,600 (-19.1%) in the first quarter of 2025. Despite the year-over-year decline, job vacancies in health occupations remain elevated compared to pre-pandemic levels (39,000 in the fourth quarter of 2019). Vacancies for registered nurses and registered psychiatric nurses (-7,700 to 21,000), nurse aides, orderlies and patient service associates (-4,900 to 16,100) and licensed practical nurses (-2,700 to 10,000) recorded the largest decreases from the first quarter of 2024 to the first quarter of 2025. In the first quarter of 2025, these three occupations together accounted for 63.0% of the total vacancies in health occupations (not seasonally adjusted).
Job vacancies in sales and service occupations at their lowest since the fourth quarter of 2016
Job vacancies in sales and service occupations fell by 4,600 (-3.0%) to 148,600 in the first quarter of 2025, the lowest level since the fourth quarter of 2016 (147,200). Despite the decrease, vacancies in sales and service occupations continued to account for the largest proportion of vacancies (28.3%) of all broad occupational groups in the first quarter of 2025.
The decline in vacancies in sales and service occupations came primarily from permanent positions (-4,500; -3.4%), as temporary positions in sales and service occupations were little changed.
Year over year, job vacancies in sales and service occupations declined by 31,200 (-19.2%) in the first quarter of 2025. This was the largest year-over-year decline among all the broad occupational groups. Within sales and service occupations, vacancies for retail salespersons and visual merchandisers (-3,900 to 12,100), food counter attendants, kitchen helpers and related support occupations (-3,800 to 22,900), and other customer and information services representatives (-3,600 to 5,900) recorded the largest year-over-year declines (not seasonally adjusted).
Job vacancies in trades, transport and equipment operators and related occupations continue downward trend
In the first quarter of 2025, job vacancies fell by 3,300 (-3.2%) to 97,300 in trades, transport and equipment operators and related occupations.
On a year-over-year basis, the number of vacant positions in trades, transport and equipment operators and related occupations was down by 27,000 (-23.7%) in the first quarter. This included declines in vacancies for construction trade helpers and labourers (-4,400 to 8,500) and transport truck drivers (-3,700 to 11,800) (not seasonally adjusted).
Growth in average offered hourly wage slows in the first quarter
On a year-over-year basis, the average offered hourly wage for vacant positions grew 6.1% to $28.90 in the first quarter of 2025, compared with growth of 7.4% (to $28.30) in the fourth quarter of 2024, and 7.6% (to $27.55) in the third quarter of 2024 (data in this section are not seasonally adjusted).
In comparison, year-over-year growth in average hourly wages for all employees (from the Labour Force Survey) was 3.6% in the first quarter of 2025, down from 4.4% in the previous quarter.
Recent increases in average offered hourly wages for vacant positions were partly due to a shift in the relative composition of job vacancies towards occupations that typically offer higher wages. Using a method that holds constant the composition of job vacancies by occupation (based on the composition observed in the first quarter of 2024), average offered hourly wages grew by 4.7% on a year-over-year basis in the first quarter of 2025, down from 5.1% in the fourth quarter and 5.2% in the third quarter of 2024.
Compared to the first quarter of 2024, the average offered hourly wage rose in all 10 broad occupational groups in the first quarter of 2025. The largest annual growth took place in legislative and senior management occupations (+13.7% to $88.15), natural resources, agriculture and related production occupations (+9.7% to $24.35) and occupations in manufacturing and utilities (+8.6% to $26.55).
Largest decline in vacancies for positions requiring a high school diploma or less
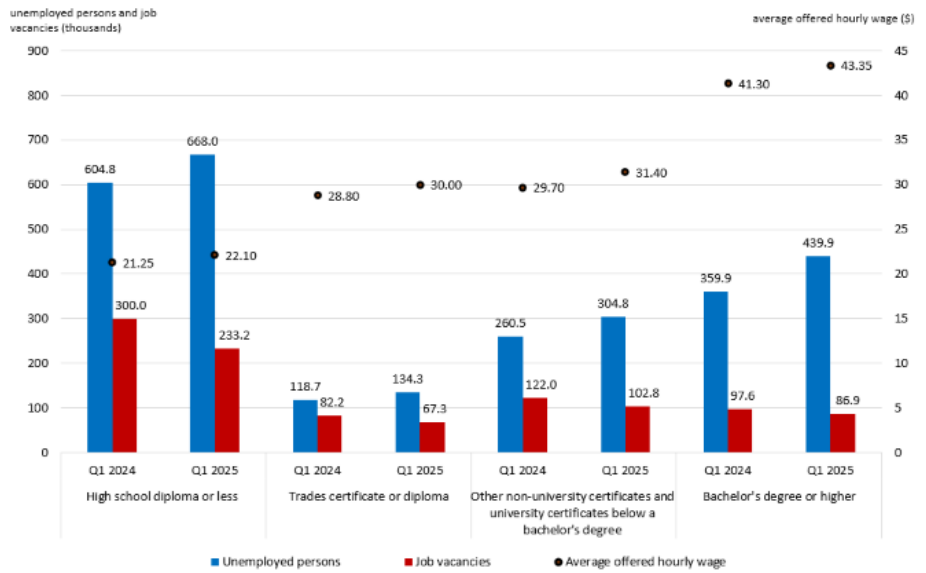
Compared with a year earlier, job vacancies were down in positions for all educational levels in the first quarter of 2025. Vacancies requiring a high school diploma or less fell the most (-66,800; -22.3%) and accounted for three-fifths (-59.9%) of the overall year-over-year decline in job vacancies. The ratio of the number of unemployed people with a high school diploma or less for every job vacancy requiring this level of education increased from 2.0 in the first quarter of 2024 to 2.9 in the first quarter of 2025 (data in this section are not seasonally adjusted).
Over the same period, the number of vacancies for positions requiring a bachelor's degree or higher fell by 10,700 (-11.0%), while the number of unemployed people with a bachelor's degree or higher rose by 80,000 (+22.2%). The unemployment-to-job vacancy ratio for this level of education was 5.1 in the first quarter of 2025, up from 3.7 in the same quarter of 2024.
In the first quarter of 2025, the average offered hourly wage for job vacancies requiring a bachelor's degree or higher was $43.35, nearly twice that for vacancies requiring a high school diploma or less ($22.10).
Chart 4: Job vacancies down year over year for all educational levels
Description - Chart 4
This is a scatter and bar combination chart.
The vertical axis on the left shows the number of unemployed persons (blue bar) and job vacancies (dark red bar) in thousands by increments of 100. It starts at 0 and ends at 900.
The vertical axis on the right shows the average offered hourly wages in dollars, by increments of $5. It starts at $0 and ends at $45.
The horizontal axis shows the first quarter of 2024 and the first quarter of 2025 for each selected educational group: high school diploma or less, trades certificate or diploma, other non-university certificate and university certificates below a bachelor's degree, and bachelor's degree or higher.
The first blue bar represents the first quarter of 2024 for unemployed persons holding high school diploma or less, with the number of unemployed persons at 604.8.
The second blue bar represents the first quarter of 2025 for unemployed persons holding high school diploma or less, with the number of unemployed persons at 668.0.
The third blue bar represents the first quarter of 2024 for unemployed persons holding trades certificate or diploma, with the number of unemployed persons at 118.7.
The fourth blue bar represents the first quarter of 2025 for unemployed persons holding trades certificate or diploma, with the number of unemployed persons at 134.3.
The fifth blue bar represents the first quarter of 2024 for unemployed persons holding other non-university certificate and university certificates below a bachelor's degree, with the number of unemployed persons at 260.5.
The sixth blue bar represents the first quarter of 2025 for unemployed persons holding other non-university certificate and university certificates below a bachelor's degree, with the number of unemployed persons at 304.8.
The seventh blue bar represents the first quarter of 2024 for unemployed persons holding bachelor's degree or higher, with the number of unemployed persons at 359.9.
The eighth blue bar represents the first quarter of 2025 for unemployed persons holding bachelor's degree or higher, with the number of unemployed persons at 439.9.
The first dark red bar represents the first quarter of 2024 for job vacancies requiring high school diploma or less, with job vacancies at 300.0. The average offered hourly wage for this group was $21.25 in the first quarter of 2024.
The second dark red bar represents the first quarter of 2025 for job vacancies requiring high school diploma or less, with job vacancies at 233.2. The average offered hourly wage was $22.10 in the first quarter of 2025.
The third dark red bar represents the first quarter of 2024 for job vacancies requiring trades certificate or diploma, with job vacancies at 82.2. The average offered hourly wage for this group was $28.80 in the first quarter of 2024.
The fourth dark red bar represents the first quarter of 2025 for job vacancies requiring trades certificate or diploma, with job vacancies at 67.3. The average offered hourly wage for this group was $30.00 in the first quarter of 2025.
The fifth dark red bar represents the first quarter of 2024 for job vacancies requiring other non-university certificate and university certificates below a bachelor's degree, with job vacancies at 122.0. The average offered hourly wage for this group was $29.70 in the first quarter of 2024.
The sixth dark red bar represents the first quarter of 2025 for job vacancies requiring other non-university certificate and university certificates below a bachelor's degree, with job vacancies at 102.8. The average offered hourly wage for this group was $31.40 in the first quarter of 2025.
The seventh dark red bar represents the first quarter of 2024 for job vacancies requiring bachelor's degree or higher, with job vacancies at 97.6. The average offered hourly wage for this group was $41.30 in the first quarter of 2024.
The eighth dark red bar represents the first quarter of 2025 for job vacancies requiring bachelor's degree or higher, with job vacancies at 86.9. The average offered hourly wage for this group was $43.35 in the first quarter of 2025.
Notes: Data are not seasonally adjusted. Q = quarter.
Sources: Job Vacancy and Wage Survey (5217), table 14-10-0443-01, and Labour Force Survey (3701), table 14-10-0019-01.
Job vacancies down in five provinces and one territory
In the first quarter, job vacancies decreased in Quebec (-9,500 to 120,400), British Columbia (-6,600 to 85,100), Alberta (-4,300 to 61,700), Manitoba (-1,200 to 19,800), New Brunswick (-700 to 8,900) and in the Northwest Territories (-300 to 800). There was little variation in the other provinces and territories.
On a year-over-year basis, the job vacancy rate was down in 50 of the 69 economic regions, with the largest decreases in the Northwest Territories (-2.3 percentage points to 3.5%), Swift Current–Moose Jaw (-1.8 percentage points to 3.1%) and Yukon (-1.8 percentage points to 3.7%).
Meanwhile, the job vacancy rate rose in three regions: Laval (+0.7 percentage points to 3.9%), Côte-Nord and Nord-du-Québec (+0.6 percentage points to 4.5%) and Northwest Ontario (+0.5 percentage points to 5.3%).
Map 1: Year-over-year job vacancy rate decreases in all provinces in the first quarter of 2025
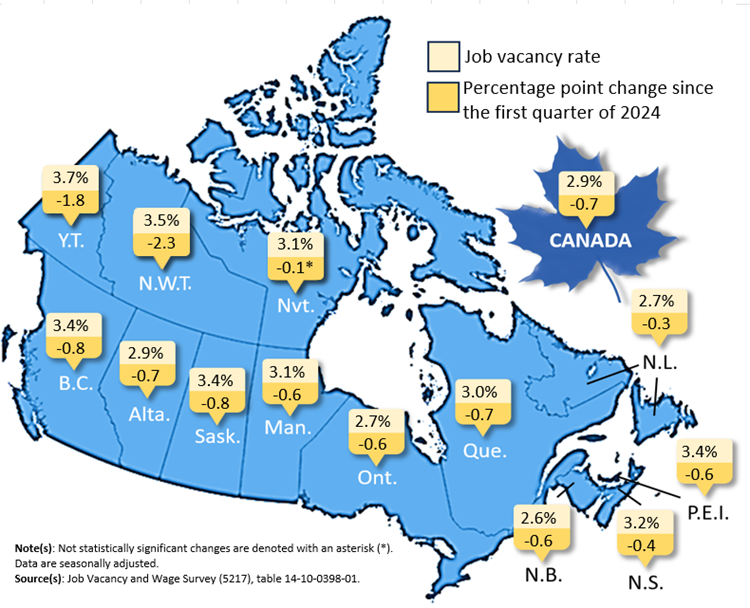
Description - Map 1
This is a map of Canada by province and territory showing job vacancy rate in the first quarter of 2025 and the percentage point change from the first quarter of 2024 to the first quarter of 2025.
The job vacancy rate in Canada was 2.9% in the first quarter of 2025, and the percentage point change from the first quarter of 2024 to the first quarter of 2025 was -0.7.
The job vacancy rate in Newfoundland and Labrador was 2.7% in the first quarter of 2025, and the percentage point change from the first quarter of 2024 to the first quarter of 2025 was -0.3.
The job vacancy rate in Prince Edward Island was 3.4% in the first quarter of 2025, and the percentage point change from the first quarter of 2024 to the first quarter of 2025 was -0.6.
The job vacancy rate in Nova Scotia was 3.2% in the first quarter of 2025, and the percentage point change from the first quarter of 2024 to the first quarter of 2025 was -0.4.
The job vacancy rate in New Brunswick was 2.6% in the first quarter of 2025, and the percentage point change from the first quarter of 2024 to the first quarter of 2025 was -0.6.
The job vacancy rate in Quebec was 3.0% in the first quarter of 2025, and the percentage point change from the first quarter of 2024 to the first quarter of 2025 was -0.7.
The job vacancy rate in Ontario was 2.7% in the first quarter of 2025, and the percentage point change from the first quarter of 2024 to the first quarter of 2025 was -0.6.
The job vacancy rate in Manitoba was 3.1% in the first quarter of 2025, and the percentage point change from the first quarter of 2024 to the first quarter of 2025 was -0.6.
The job vacancy rate in Saskatchewan was 3.4% in the first quarter of 2025, and the percentage point change from the first quarter of 2024 to the first quarter of 2025 was -0.8.
The job vacancy rate in Alberta was 2.9% in the first quarter of 2025, and the percentage point change from the first quarter of 2024 to the first quarter of 2025 was -0.7.
The job vacancy rate in British Columbia was 3.4% in the first quarter of 2025, and the percentage point change from the first quarter of 2024 to the first quarter of 2025 was -0.8.
The job vacancy rate in Yukon was 3.7% in the first quarter of 2025, and the percentage point change from the first quarter of 2024 to the first quarter of 2025 was -1.8.
The job vacancy rate in Northwest Territories was 3.5% in the first quarter of 2025, and the percentage point change from the first quarter of 2024 to the first quarter of 2025 was -2.3.
The job vacancy rate in Nunavut was 3.1% in the first quarter of 2025, and the percentage point change from the first quarter of 2024 to the first quarter of 2025 was -0.1*.
Notes: Not statistically significant changes are denoted with an asterisk (*). Data are seasonally adjusted.
Sources: Job Vacancy and Wage Survey (5217), table 14-10-0398-01.
Note to readers
The Job Vacancy and Wage Survey (JVWS) provides comprehensive data on job vacancies and offered wages by industrial sector and detailed occupation for Canada and the provinces, territories and economic regions. Additional information is also available by occupation, such as the proportion of job vacancies for full-time and part-time positions, the duration of job vacancies, the levels of education and experience sought for the job, and other characteristics. Job vacancy, offered wage, and vacancy characteristics data are released quarterly.
Estimates by sector are based on the North American Industry Classification System 2022 Version 1.0. Estimates by geographical area are based on the Standard Geographical Classification 2021. Estimates by occupation reflect the National Occupational Classification (NOC) 2021 Version 1.0. The NOC is a five-tiered hierarchical structure of occupational groups with successive levels of disaggregation. The structure is as follows: (1) 10 broad occupational categories, also referred to as one-digit NOC; (2) 45 major groups, also referred to as two-digit NOC; (3) 89 sub-major groups, also referred to as three-digit NOC; (4) 162 minor groups, also referred to as four-digit NOC; and (5) 516 unit groups, also referred to as five-digit NOC.
Because of the COVID-19 pandemic, data collection for the JVWS was suspended for the second and third quarters of 2020.
Preliminary monthly estimates are produced for job vacancies and job vacancy rates by province and by industrial sector. These JVWS preliminary monthly estimates are released on a monthly basis with the estimates from the Survey of Employment, Payrolls and Hours. More information about the concepts and use of data from the JVWS is available in the Guide to the Job Vacancy and Wage Survey (75-514-G).
The target population of the survey includes all business locations in Canada, excluding those involved primarily in religious organizations and private households. Federal, provincial, and territorial, as well as international and other extraterritorial public administrations, are also excluded from the survey.
Unless otherwise stated, this release presents seasonally adjusted estimates, which facilitate comparisons by removing the effects of seasonal variations. For more information on seasonal adjustment, see Seasonally adjusted data – Frequently asked questions.
Seasonally adjusted quarterly job vacancy data are available online (tables 14-10-0398-01, 14-10-0399-01 and 14-10-0400-01). The analyses of the job vacancy levels and rates by sector (20 broad industrial sector groups), one-digit NOC (10 broad occupational categories), province and economic region are based on seasonally adjusted data. However, the analyses of the job vacancy levels and rates by subsector, two-digit NOC, three-digit NOC, four-digit NOC, and five-digit NOC are based on non-seasonally adjusted data.
The unemployment-to-job vacancy ratio excludes the territories for consistency with the geographic coverage of the Labour Force Survey.
This analysis focuses on differences between estimates that are statistically significant at the 68% confidence level.
Revisions to seasonally-adjusted Job Vacancy and Wage Survey tables
On June 17, 2025, revised quarterly JVWS seasonally adjusted data were released resulting in minor changes to the estimates. Estimates from the first quarter of 2015 to the fourth quarter of 2024 were republished incorporating a fine-tuning of the parameters used in the seasonal adjustment process. Estimates from the first quarter of 2025 onward also use the updated seasonal adjustment parameters.
Data tables
Tables 14-10-0325, 14-10-0326, 14-10-0328 and 14-10-0356 have now been archived. They have been replaced with tables 14-10-0441-01, 14-10-0442-01, 14-10-0443-01, and 14-10-0444-01, respectively, presenting the new classifications.
Data tables are updated on June 17, 2025.
Reference
Data tables: Access the latest tables.
- Note: some data tables may best be viewed on desktop.
Definitions, data sources and methods: survey number 5217.
Previous release: Job vacancies, fourth quarter 2024.
Next release: September 16, 2025.
Contact information
For more information, or to enquire about the concepts, methods or data quality of this release, contact us (toll-free 1-800-263-1136; 514-283-8300; infostats@statcan.gc.ca) or Media Relations (statcan.mediahotline-ligneinfomedias.statcan@statcan.gc.ca).