
The condition of ocean waters surrounding Canada has significant effects on Canadians and people around the world.
Shifts in ocean temperature can impact marine ecosystems, disrupt the fishing industry, and contribute to sea level rise and more intense storms. Changes in levels of particulate carbon and chlorophyll indicate fluctuations in plankton populations, which are critical to the ocean food web and play a key role in carbon sequestration and oxygen production.
Sea surface temperatures warming across Canadian ocean waters
The ocean surface absorbs heat from the sun and atmosphere, which is then distributed throughout the ocean. While sea surface temperature varied across marine bioregions, all marine bioregions have shown a warming trend since 1982.
The bioregions that experienced the greatest degree of warming from 1982 to 2024 included the Scotian Shelf (+0.53 °C per decade), Strait of Georgia (+0.36 °C per decade), Newfoundland-Labrador Shelves (+0.33 °C per decade), and Gulf of St. Lawrence (+0.33 °C per decade).
Sea surface temperatures were generally warmest in the Scotian Shelf marine bioregion, with annual average temperatures ranging from 10.7 to 13.6 °C from 1982 to 2024. Marine bioregions in the Pacific followed with annual average temperatures ranging from 8.9 to 12.2 °C.
Annual average sea surface temperatures ranged from 3.6 to 7.2 °C in the Gulf of St. Lawrence and Newfoundland-Labrador Shelves and from -0.3 to 1.3 °C in the Hudson Bay Complex marine bioregions. The Arctic bioregions have the coldest sea surface temperatures, with annual averages ranging from -1.6 to 0.2 °C during this period.
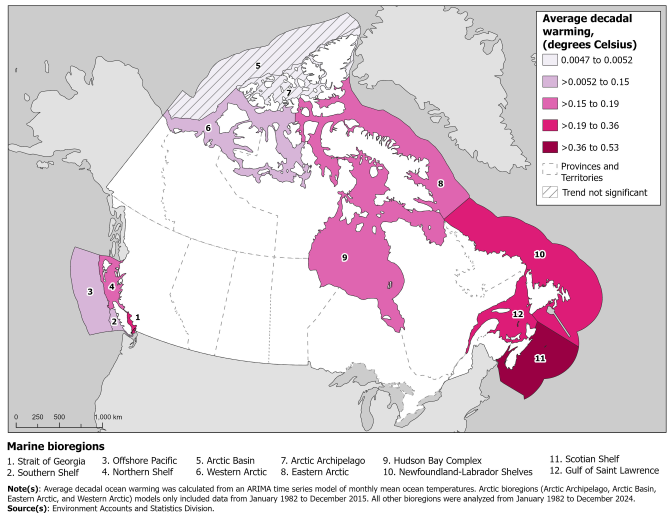
Map 1: Average decadal ocean warming, by marine bioregion, since 1982
Description - Map 1
This map provides a visual representation of the degree of ocean warming per decade in each marine bioregion in Canada.
On the image, there is one large map of Canada and two legends. On the map, marine bioregions are outlined in grey and labeled with a numeric code. The marine bioregions are filled with fuchsia, the intensity of which corresponds to its degree of average decadal warming. Dashed grey lines show provincial and territorial boundaries. A legend in the upper right corner describes how information is displayed on the map, and the legend under the map provides the name of the marine bioregion corresponding to each numeric code.
The map shows that the highest degree of warming since 1982 occurred in the Scotian shelf, followed by the Strait of Georgia, Newfoundland-Labrador Shelves and Gulf of St. Lawrence. The Eastern Arctic, Hudson Bay complex, and Northern Shelf all had decadal warming trends from 0.16 to 0.19 degrees Celsius. The marine bioregions in the second lowest warming category are the Southern shelf, Offshore Pacific, and Western Arctic. The Arctic Basin and Arctic Archipelago experienced the lowest degree of warming, and both of these trends were insignificant.
The legend in the upper right-hand corner of the map described how information is displayed on the map.
The fuchsia shaded area indicates average decadal warming (degrees Celsius) of marine bioregions. The shading intensity varies, with the lightest fuchsia representing a change in ocean temperature from 0.0047 to 0.0052 degrees Celsius per decade and the darkest fuchsia representing a change in ocean temperature from 0.37 to 0.53 degrees Celsius per decade.
Marine bioregions where the trend was not statistically significant are represented by hatching in the bioregion.
Note: Average decadal ocean warming was calculated from an ARIMA time series model of monthly mean ocean temperatures. Arctic bioregions (Arctic Archipelago, Arctic Basin, Eastern Arctic, and Western Arctic) models only included data from January 1982 to December 2015. All other bioregions were analyzed from January 1982 to December 2024.
Source: Environment Accounts and Statistics Division.
Marine phytoplankton critical for fish stocks and global climate
Phytoplankton are microscopic plants that capture carbon dioxide through photosynthesis. This carbon moves through the marine food web and eventually forms part of particulate organic carbon (POC). This process is a major pathway for carbon sequestration as POC sinks and is stored deep in the ocean. The presence of phytoplankton can be measured by chlorophyll-a.
Marine bioregions with higher chlorophyll-a concentrations also had higher POC concentrations. From 2000 to 2022, the Strait of Georgia marine bioregion had the highest concentrations of chlorophyll-a, with monthly averages ranging from 9.5 to 21.7 mg/m3 and POC monthly averages ranging from 932 to 2,176 mg/m3.
The Gulf of St. Lawrence, Southern Shelf, and Northern Shelf marine bioregions shared similar minimum monthly average chlorophyll-a concentrations of approximately 1 mg/m3 and maximum monthly averages ranging from 5.8 to 9.3 mg/m3. Minimum monthly average POC concentrations ranged from 226 to 295 mg/m3, and maximum monthly average concentrations ranged from 1,450 to 1,717 mg/m3 among the same bioregions.
Note to readers
Statistics Canada's Census of Environment program reports on ecosystems in Canada, providing information to help Canadians make evidence-based decisions to protect, rehabilitate, enhance, and sustain our environment. It follows the internationally accepted environmental–economic standard for producing information on ecosystems' extent, their condition and the services they provide, the System of Environmental Economic Accounting.
New ocean condition account tables (38-10-0182 and 38-10-0183) are now available as part of the Ocean and coastal ecosystem accounts. These tables provide long-term monthly time series data on sea surface temperature, chlorophyll-a and particulate organic carbon. These variables offer critical insight into the condition of ocean surface waters and are essential for understanding the ecosystem services provided by ocean ecosystems. Data are available by marine bioregion and by Pacific Fisheries Management Area and Northwest Atlantic Fisheries Organization fishing area geographies.
Source data include products derived from satellite Earth observation including Moderate Resolution Imaging Spectroradiometer Terra and National Oceanic and Atmospheric Administration Climate Data Records Optimum Interpolation Sea Surface Temperature.
Note: Time series trend analysis covered temperature data from January 1982 to December 2024. For the Arctic marine bioregions (Arctic Archipelago, Arctic Basin, Eastern Arctic and Western Arctic), the trend analysis only covered data from January 1982 to December 2015 due to a methodological change in the underlying dataset in 2016. Trends were not run for chlorophyll-a and POC datasets due to a large amount of missing data for all bioregions. The Arctic and Hudson Bay marine bioregions had little to no POC and chlorophyll-a data and are therefore not reported on here.
Today's release also includes an update to the Agroecosystem condition table (38-10-0164). This update includes four new variables: turbulence index for crop rotation diversity, Shannon Diversity Index, pesticide concentration in water, and residual soil nitrogen.
For more information, see Canadian System of Environmental-Economic Accounting – Ecosystem Accounts (5331).
Contact information
For more information, or to enquire about the concepts, methods or data quality of this release, contact us (toll-free 1-800-263-1136; 514-283-8300; infostats@statcan.gc.ca) or Media Relations (statcan.mediahotline-ligneinfomedias.statcan@statcan.gc.ca).