

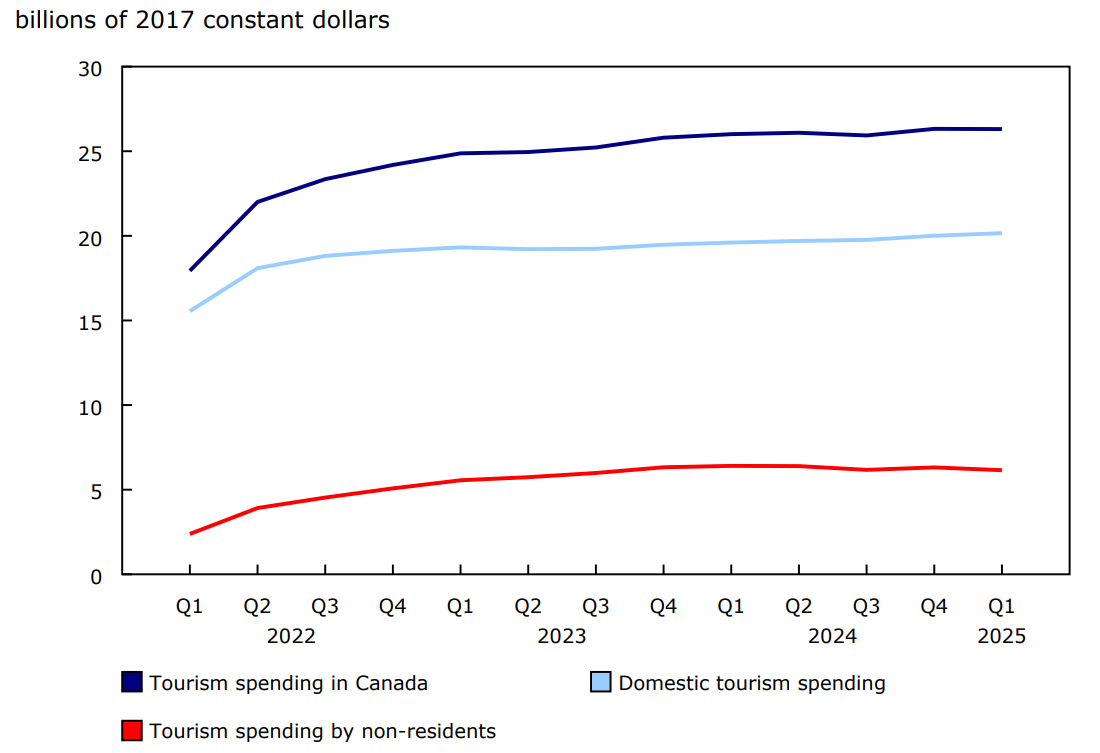
Tourism spending was virtually unchanged in the first quarter of 2025 after increasing 1.5% in the fourth quarter of 2024. Domestic tourism spending increased 0.8% in the first quarter of 2025 as Canadians pulled back from international travel to the United States. Gains in tourism spending by Canadians at home were offset by lower tourism exports (-2.6%), which refer to non-resident spending in Canada.
Chart 1: Tourism spending virtually unchanged in the first quarter of 2025
Description - Chart 1
Data table: Tourism spending virtually unchanged in the first quarter of 2025
Note: Q = Quarter. Data are adjusted for seasonal variations and price changes.
Source: Table 36-10-0230-01.
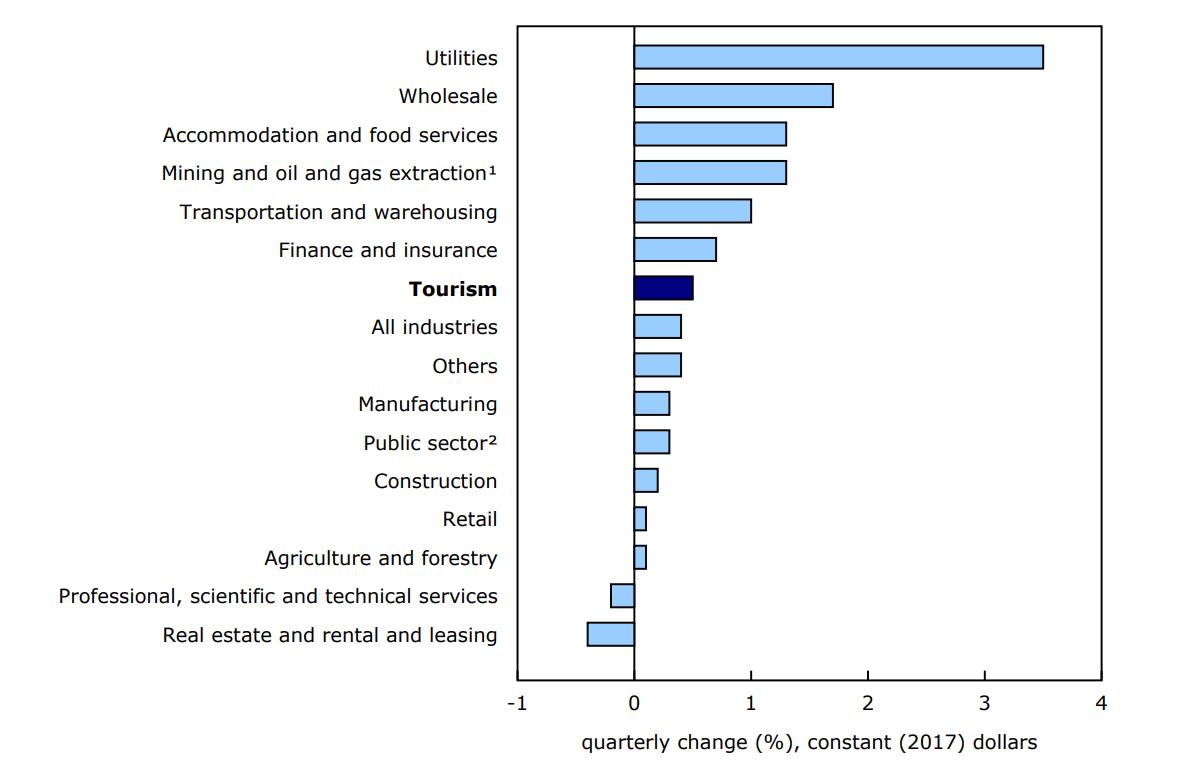
Tourism gross domestic product (GDP) grew 0.5% in the first quarter of 2025, compared to growth of 1.3% in the fourth quarter of 2024. By comparison, economy-wide GDP by industry was up 0.4% in the first quarter of 2025.
Growth in tourism GDP in the first quarter was driven by accommodation services (+2.0%), followed by food and beverage services (+1.0%). These gains were partially offset by declines in other tourism industries (-1.2%) and transportation (-0.3%) during the quarter.
On a nominal basis, tourism's share of GDP was 1.74% in the first quarter, down from 1.79% recorded in the previous quarter.
Chart 2: Tourism and major industrial sectors, gross domestic product, first quarter of 2025
Description - Chart 2
Data table: Tourism and major industrial sectors, gross domestic product, first quarter of 2025
1. Includes quarrying.
2. Educational services, health care and social assistance, and public administration.
Note: Data are adjusted for seasonal variations and price changes.
Sources: Tables 36-10-0449-01 and 36-10-0234-01.
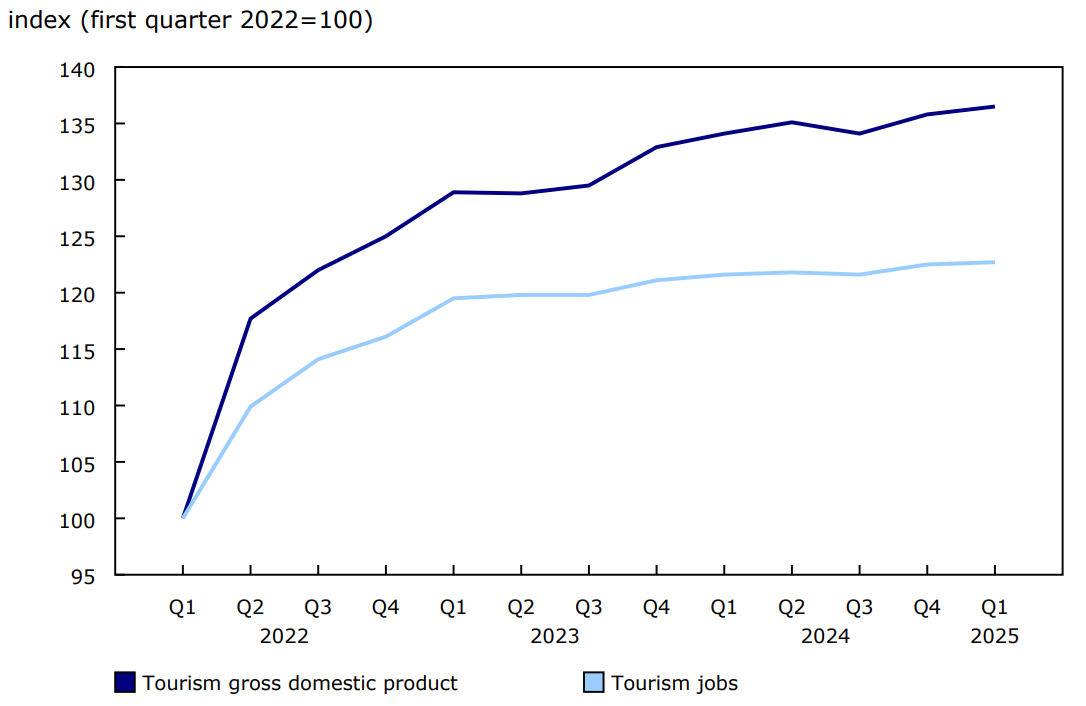
The number of jobs attributable to tourism edged up 0.1% in the first quarter of 2025, following a 0.8% increase in the fourth quarter of 2024. The gains in food and beverages services (+0.6%) and accommodation services (+0.4%) were largely offset by declines in recreation and entertainment (-1.0%) and travel services (-1.6%). The total number of tourism jobs in Canada reached 707,400 in the first quarter, up slightly from 706,500 in the fourth quarter. Tourism's share of total jobs was 3.30% in the first quarter.
Chart 3: Tourism gross domestic product and jobs attributable to tourism increase in the first quarter of 2025
Description - Chart 3
Data table: Tourism gross domestic product and jobs attributable to tourism increase in the first quarter of 2025
Notes: Q = Quarter. Data are adjusted for seasonal variations. Tourism gross domestic product is adjusted for price changes.
Sources: Tables 36-10-0234-01 and 36-10-0232-01.
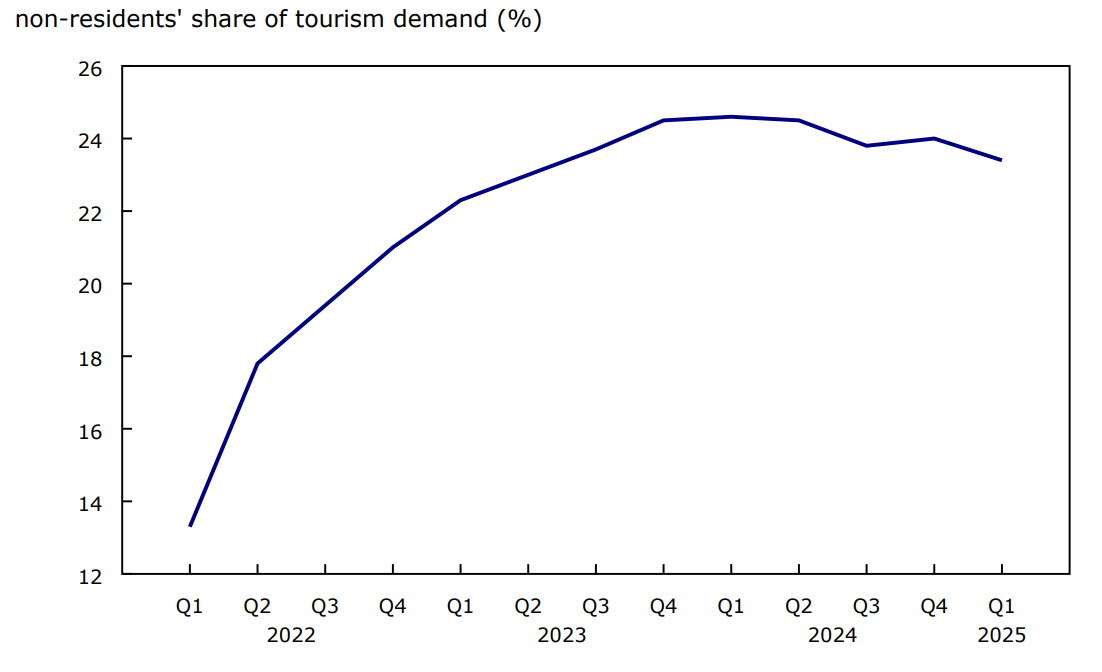
Tourism spending by international visitors declines
Tourism spending by international visitors in Canada was down (-2.6%) in the first quarter, compared to a 2.3% increase in the fourth quarter of 2024. Major contributors to the decline were accommodation (-2.7%), passenger air transport (-2.4%) and food and beverage services (-2.7%).
Overnight travel to Canada by international visitors declined 4.8% in the first quarter.
Chart 4: Share of tourism spending in Canada by international visitors declines in the first quarter of 2025
Description - Chart 4
Data table: Share of tourism spending in Canada by international visitors declines in the first quarter of 2025
Note: Q = Quarter. Data are adjusted for seasonal variations and price changes.
Source: Table 36-10-0230-01.
Tourism spending in Canada by Canadian residents increases
Tourism spending in Canada by Canadian residents was up 0.8% in the first quarter of 2025, following a 1.2% increase in the fourth quarter of 2024. The increase in the first quarter was driven by domestic tourism spending on accommodation services (+5.1%), food and beverage services (+2.5%) and non-tourism products (+2.2%).
Spending on travel services (-8.5%) and pre-trip expenditures (-6.5%) decreased in the first quarter of 2025, which may indicate changing travel plans by Canadians in the first quarter and subsequent months. The number of overnight trips by Canadians returning from the United States decreased in the first quarter (-12.2%) and in April (-7.3%). Domestic tourism spending includes tourism spending by Canadian residents on Canadian goods and services, even if these goods and services are for travel outside Canada.
Looking ahead
The number of arrivals by land and by air by non-residents declined year over year in April and May 2025, according to leading indicators of Frontier Counts data. The number of Canadian travellers returning by land and by air also declined in April and May 2025.
Focus on Canada and the United States
Travel and tourism: trade balance with the United States
US travellers took fewer trips to Canada in the first quarter of 2025 compared to the fourth quarter of 2024, with declines in both overnight travel (-5.4%) and excursions (-1.0%). The number of Canadian residents returning from the United States also declined (-16.3%) in the first quarter of 2025. While excursions accounted for most of the decline (-20.8%), the number of overnight trips was also down (-12.2%).
The Canadian travel deficit with the United States (not adjusted for seasonality) was $5.6 billion in the first quarter of 2025, compared to $6.4 billion in the first quarter of 2024. Travel receipts decreased 2.3% on a year-over-year basis in the first quarter, while payments fell 10.3%.
While the concepts of international travel and international tourism differ slightly, international travel spending serves as a reliable proxy for tourism trade activity. Travel spending estimates include some spending for education- and medical-related travel, as well as spending by crew members which are not considered as tourism spending. Conversely, it excludes international passenger fares, which are part of tourism spending.
For more data and insights on areas touched by the socio-economic relationship between Canada and the United States, see the Focus on Canada and the United States webpage.
Sustainable development goals
On January 1, 2016, the world officially began implementing the 2030 Agenda for Sustainable Development—the United Nations' transformative plan of action that addresses urgent global challenges over the next 15 years. The plan is based on 17 specific sustainable development goals.
The national tourism indicators are an example of how Statistics Canada supports the reporting on the global goals for sustainable development. This release will be used in helping to measure the following goal:
Note to readers
With the first quarter 2025 release of the national tourism indicators, all data from the first to the fourth quarters of 2024 have been revised.
Growth rates for tourism spending and gross domestic product (GDP) are expressed in real terms (that is, adjusted for price changes), using reference year 2017, as well as adjusted for seasonal variations, unless otherwise indicated.
Tourism jobs data are also seasonally adjusted.
Tourism's share of economy-wide GDP is calculated from seasonally adjusted nominal values.
Tourism's share of economy-wide jobs is calculated using seasonally adjusted values.
Economy-wide GDP is obtained from table 36-10-0449-01. Economy-wide total number of jobs is obtained from table 36-10-0207-01. Travel to Canada by international visitors and travel by Canadians returning to Canada are obtained from table 24-10-0054-01.
For information on seasonal adjustment, see Seasonally adjusted data – Frequently asked questions.
Associated percentage changes are presented at quarterly rates unless otherwise noted.
Non-tourism industries, also referred to as other industries, are industries that would continue to exist in the absence of tourism. For example, retail trade industries, which benefit from tourism activity, would not cease to exist in the absence of tourism. Tourism GDP takes into account the goods and services produced by these other industries and purchased by tourists.
Non-tourism products, also referred to as other products, are products for which a significant part of its total demand in Canada does not come from visitors, such as groceries, clothing and alcoholic beverages bought in stores.
The national tourism indicators are funded by Destination Canada.
Reference
Data tables: Access the latest tables.
- Note: some data tables may best be viewed on desktop.
Definitions, data sources and methods: survey number 1910.
Previous release: National tourism indicators, fourth quarter 2024.
Next release: September 26, 2025.
Contact information
For more information, or to enquire about the concepts, methods or data quality of this release, contact us (toll-free 1-800-263-1136; 514-283-8300; infostats@statcan.gc.ca) or Media Relations (statcan.mediahotline-ligneinfomedias.statcan@statcan.gc.ca).