

Production of primary energy increased 3.5% on a year-over-year basis in April with five out of six sectors posting gains. Secondary energy production rose 6.6%, with refined petroleum products contributing the most to the increase.
Chart 1: Year-over-year contribution to change in primary energy production
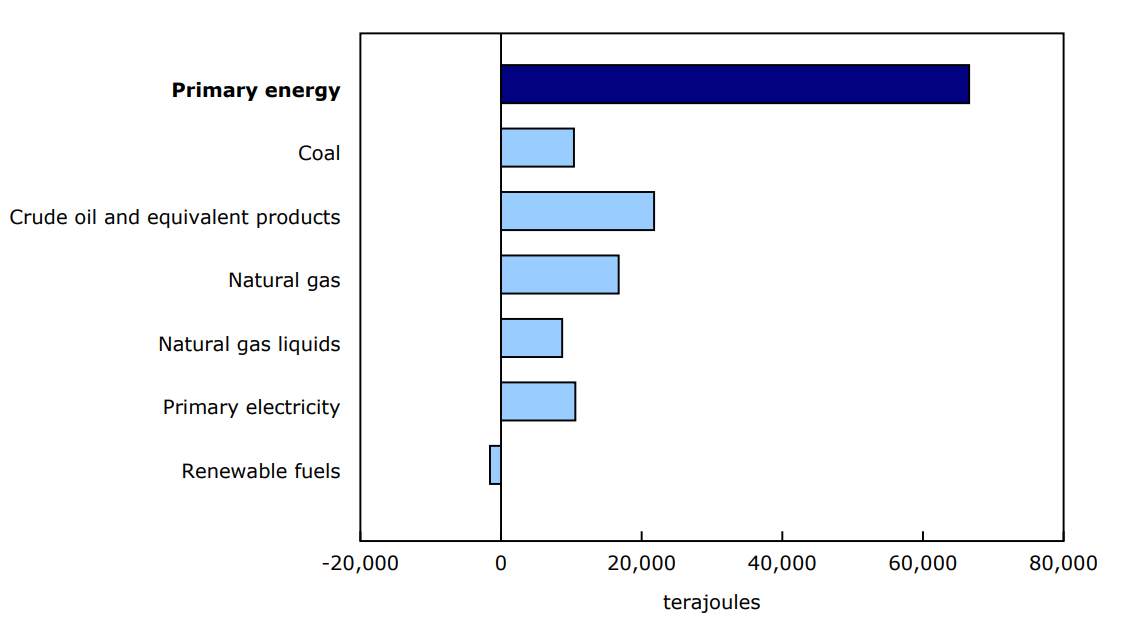
Description - Chart 1
Data table: Year-over-year contribution to change in primary energy production
Source: Table 25-10-0079-01.
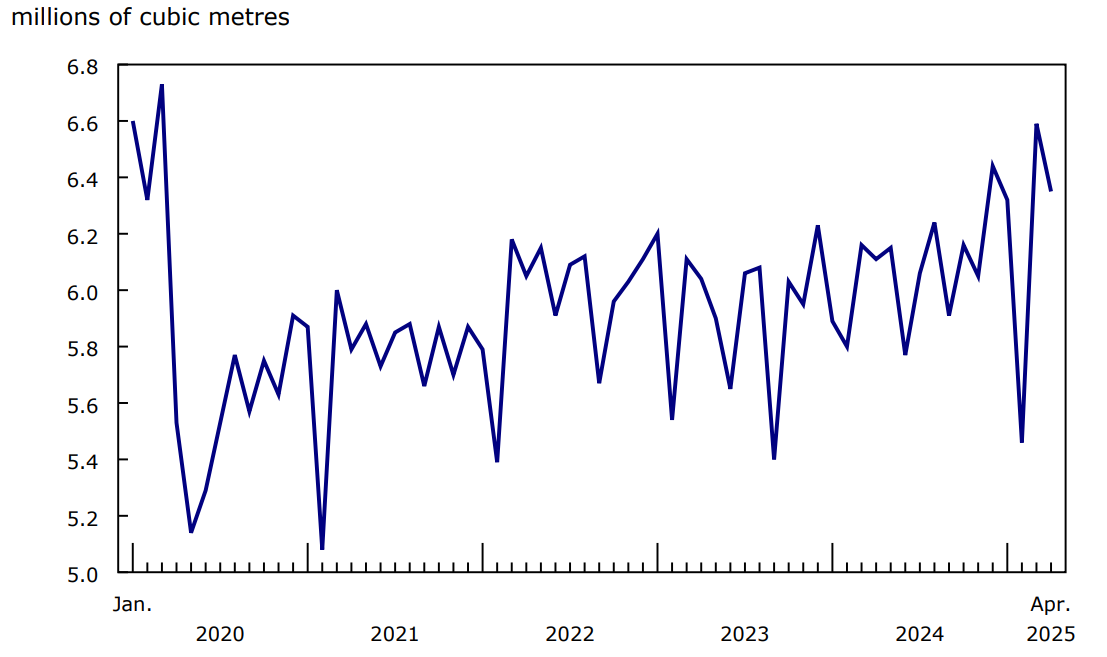
Production of crude oil rises
In April, production of crude oil and equivalent products rose 2.3% year-over-year to 24.9 million cubic metres, although down 4.0% on a daily level from the previous month as spring maintenance began in the oil sands.
The largest contribution to the overall gain was from oil extraction, rising 3.9% to 6.3 million cubic metres in April. The increase came mostly from Alberta (+5.4%) and Newfoundland and Labrador (+12.5%) where there was an increase and expansion of offshore production.
Oil sands extraction edged up 0.9% year over year to 15.9 million cubic metres in April. The increase in crude bitumen production (+3.8%) was mostly offset by a decrease in synthetic crude oil (-3.9%), as some upgraders began their turnarounds at the start of the month.
Chart 2: Canadian crude oil extraction
Production and exports of natural gas up year over year
Production of marketable natural gas rose 2.6% year over year to 672.1 million cubic metres in April, as both Alberta (+2.7%) and British Columbia (+2.6%) increased production.
Exports of natural gas to the United States climbed 9.0% to 279.1 million cubic metres in April, while imports ticked down 0.3% to 88.4 million cubic metres.
Chart 3: Canadian production and exports of natural gas
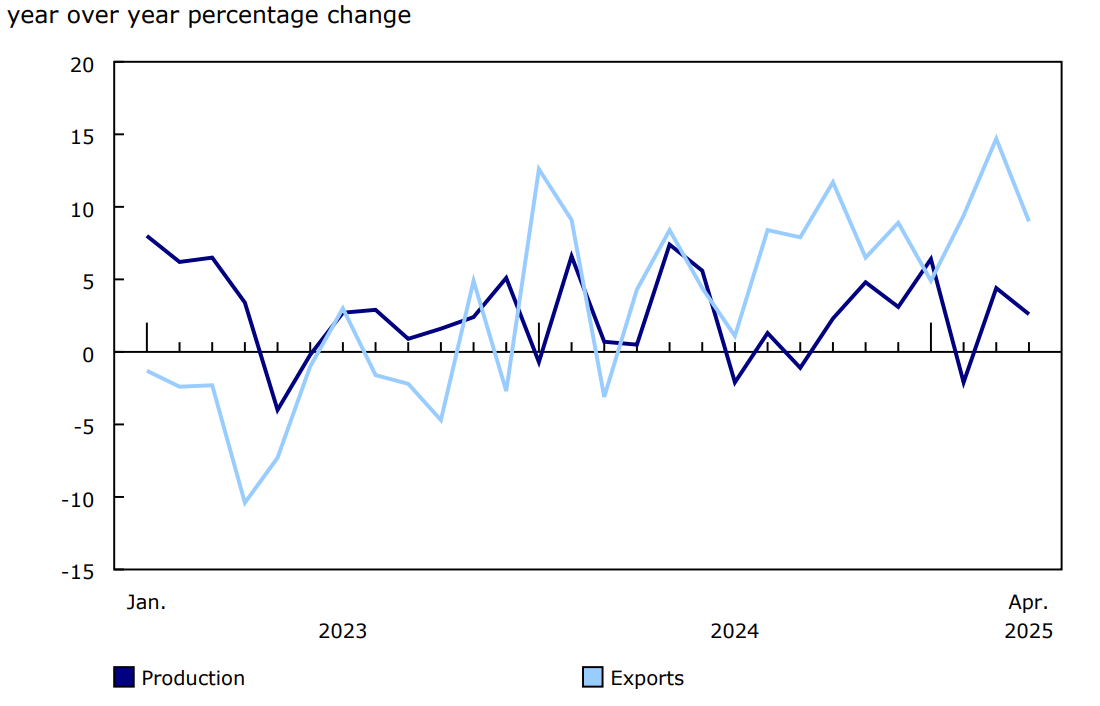
Description - Chart 3
Data table: Canadian production and exports of natural gas
Source: Table 25-10-0055-01.
Following refurbishment and maintenance activities, nuclear generation drives electricity generation gain in April
Total electricity generation in Canada increased 7.0% year over year to 48.9 million megawatt-hours (MWh) in April. Nuclear generation (+36.5%) drove the growth, as both Ontario (+28.8%) and New Brunswick (+520.9%) posted gains. In April 2024 nuclear stations in both provinces were undergoing refurbishment or maintenance activities which reduced generation levels; these activities have since been completed and the units at the affected stations have resumed operations.
Exports of electricity to the United States jumped 54.8% year over year to 2.6 million MWh in April 2025, while imports fell 34.6% to 1.7 million MWh. In 2024, drought conditions led to reduced exports and increased imports, however, conditions improved in the winter and spring of 2025.
Chart 4: Canadian nuclear electricity generation
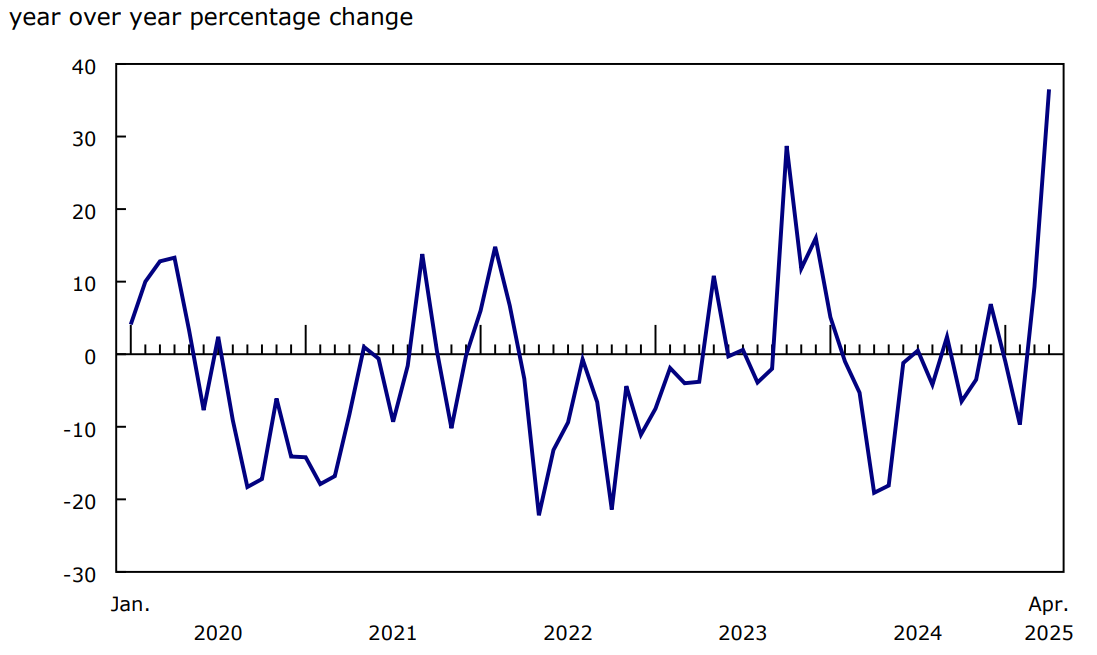
Description - Chart 4
Data table: Canadian nuclear electricity generation
Source: Table 25-10-0015-01.
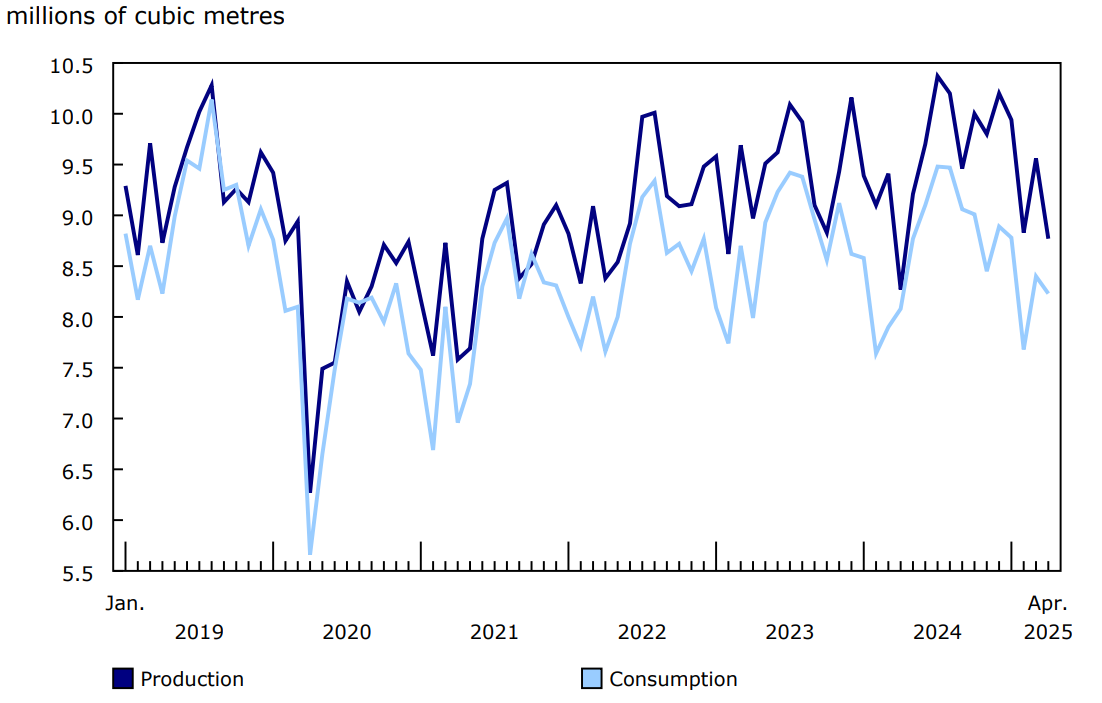
Production and consumption of refined petroleum products climb in April
Production of refined petroleum products rose 6.0% to 8.8 million cubic metres in April as distillate fuel oil (+7.0%), finished motor gasoline (+4.2%), and kerosene type jet fuel (+18.2%) all posted gains.
Consumption of refined petroleum products rose 1.8% to 8.2 million cubic metres in April, driven by a 6.8% increase in distillate fuel.
Chart 5: Canadian production and consumption of refined petroleum products
Description - Chart 5
Data table: Canadian production and consumption of refined petroleum products
Source: Table 25-10-0081-01.
Focus on Canada and the United States
Exports of crude oil to the United States by pipeline fell 9.0% to 15.8 million cubic metres in April, the lowest monthly volume since April 2022. The decline was partially attributable to a spill from the Keystone pipeline in North Dakota, which shut down the line for part of the month.
For more data and insights on areas touched by the socioeconomic relationship between Canada and the United States, see the Focus on Canada and the United States webpage.
Note to readers
The Energy Statistics Program relies on data collected from respondents and administrative sources.
The Consolidated Energy Statistics table (25-10-0079-01) presents monthly data on primary and secondary energy by fuel type (crude oil, natural gas, electricity, coal, etc.) in terajoules and supply and demand characteristics (production, exports, imports, etc.) for Canada. For more information, consult the Consolidated Energy Statistics Table: User Guide.
Data in this release are not seasonally adjusted.
The following survey programs support the "Energy statistics" release:
- Crude oil and natural gas (survey number 2198; tables 25-10-0036-01, 25-10-0055-01 and 25-10-0063-01)
- Energy transportation and storage (survey number 5300; tables 25-10-0075-01 and 25-10-0077-01)
- Natural gas transmission, storage and distribution (survey numbers 2149, 5210 and 5215; tables 25-10-0057-01, 25-10-0058-01 and 25-10-0059-01)
- Refined petroleum products (survey number 2150; table 25-10-0081-01).
- Renewable fuel and hydrogen (survey number 5294; table 25-10-0082-01)
- Electric power statistics (survey number 2151; tables 25-10-0015-01 and 25-10-0016-01)
- Coal and coke statistics (survey numbers 2147 and 2003; tables 25-10-0045-01 and 25-10-0046-01).
The newly expanded Trans Mountain pipeline began operation in May 2024, transporting crude oil and refined petroleum products from Edmonton, Alberta, to the port of Burnaby, British Columbia. This expansion nearly tripled the capacity of the existing line built in 1953, allowing for more Canadian crude oil to be exported to the global market. As a result, year-over-year rates of change are expected to be significant for some data series through to April 2025.
Revisions
Energy survey data and administrative sources are subject to revisions to reflect new or updated information. Historical revisions will be processed periodically.
Occasionally, data from Environment and Climate Change Canada are referenced by the Energy Statistics Program using Cooling Degree Days (CDDs) or Heating Degree Days (HDDs) as a measure of temperature. CDDs reflect the relationship between outdoor temperatures and the need to cool indoors to maintain room temperature. As temperatures outside rise, the number of CDDs increases. HDDs are the opposite and reflect the need to heat indoors to maintain room temperature. As temperatures outside fall, the number of HDDs increases.
Reference
Data tables: Access the latest tables.
- Note: some data tables may best be viewed on desktop.
Definitions, data sources and methods: See the associated survey numbers.
Previous release: Energy statistics, March 2025.
Contact information
For more information, or to enquire about the concepts, methods or data quality of this release, contact us (toll-free 1-800-263-1136; 514-283-8300; infostats@statcan.gc.ca) or Media Relations (statcan.mediahotline-ligneinfomedias.statcan@statcan.gc.ca).