
Highlights
Major Canadian airlines flew 7.1 million passengers on scheduled and charter services in May, down 1.8% from May 2024.
Aircraft movements at Canada's major and select small airports totalled 560,048 in May 2025, up 2.7% from the previous year. Local movements rose 7.6% year over year, while itinerant movements edged up 0.5%.
Consult the Aviation Data Visualization Hub to explore aircraft movement statistics and monthly civil aviation statistics in an interactive format.
Passenger volume weakens in May
Canadian Level I air carriers flew 7.1 million passengers on scheduled and charter services in May, 1.8% fewer than in May 2024.
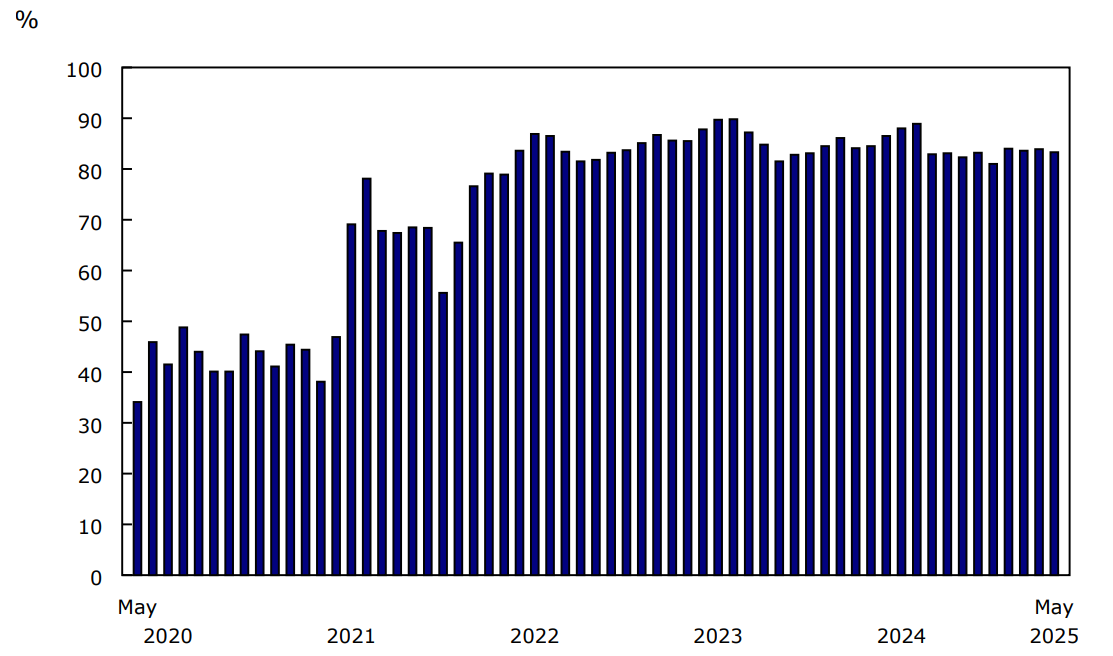
The number of passenger-kilometres decreased 0.5% year over year to 19.7 billion in May 2025. In contrast, capacity increased 0.9% to 23.6 billion available seat-kilometres. As a result, the passenger load factor (the ratio of passenger-kilometres to available seat-kilometres) was 83.3% in May, down from 84.5% in the same month one year earlier.
Chart 1: Passenger load factor, Canadian air carriers, Level I
Description - Chart 1
Data table: Passenger load factor, Canadian air carriers, Level I
Source: Table 23-10-0079-01.
Each passenger travelled an average of 2,760 kilometres in May, up 1.3% from May 2024.
Level I carriers flew 185,000 hours (+0.5%) in May 2025 and generated $2.5 billion (+2.3%) in total operating revenue.
Wildfires impact aircraft movements
In May, wildfires were active across several provinces and, by the end of the month, Manitoba and Saskatchewan declared states of emergency. This led to increases in aircraft movements at some of Canada's major and select small airports, as aircraft were actively engaged in forest firefighting. Notably, Kenora Airport in Ontario, which serves as a forest firefighting base of operations in Northern Ontario, recorded 2,353 movements, a year-over-year increase of 148.5% and the largest number of movements since July 1989. Other airports connected to wildfire control efforts also recorded significant increases in aircraft movements—Prince Albert (1,561 total movements, +47.8%) and La Ronge (1,665 movements, +16.5%) in Saskatchewan and The Pas (796 movements, +165.3%) in Manitoba.
Chart 2: Total aircraft movements at major and select small airports, by class of operation

Description - Chart 2
Data table: Total aircraft movements at major and select small airports, by class of operation
Source: Table 23-10-0296-01.
Local movements lead increase
Increased flight school activity pushed local movements up 7.6% in May to 184,172, the third consecutive monthly year-over-year increase. The strongest gain (+149.8%; +4,668 movements) was recorded at Québec/Jean Lesage International, followed by Sault Ste. Marie, where local traffic more than doubled (+209.0%; +4,000 movements) year over year in May.
At the same time, domestic itinerant movements edged up 0.9% year over year in May. Other international traffic (outside the United States) grew 1.2% from the same month of the previous year to 15,707.
In contrast, transborder activity (to and from the United States) recorded a second consecutive month of year-over-year decline in May, down 3.1% to 36,442 movements.
Focus on Canada and the United States
Transborder aircraft movements (to and from the United States) represented 9.7% of total itinerant movements at Canada's major and select small airports in May, down from 10.1% in May 2024.
In May 2025, year-over-year declines in movements to and from the United States were recorded at three of the four largest Canadian airports: Toronto/Lester B. Pearson International (-0.6%), Vancouver International (-4.0%) and Montréal/Pierre Elliot Trudeau International (-7.4%). In contrast, transborder movements at Calgary International increased 11.9%.
Meanwhile, the number of passengers carried by Canadian Level I air carriers on scheduled transborder flights in May was 12.4% below that recorded in the same month of the previous year. This was the fourth consecutive year-over-year decline and the largest of the four declines. The passenger load factor on scheduled transborder flights declined from 81.3% in May 2024 to 74.7% in May 2025.
For more data and insights on areas touched by the socio-economic relationship between Canada and the United States, see the Focus on Canada and the United States webpage.
Note to readers
This consolidated monthly release covers the following survey programs:
- Aircraft movement statistics (survey number 2715, tables 23-10-0296-01 to 23-10-0304-01)
- Monthly civil aviation statistics (survey number 5026, table 23-10-0079-01).
Consult the Aviation Data Visualization Hub to explore data from Aircraft movement statistics and Monthly civil aviation statistics in an interactive format.
The aviation statistics program uses respondent (Monthly civil aviation statistics) and administrative (Aircraft movement statistics) data.
An aircraft movement is defined as a take-off, landing or simulated approach by an aircraft, as defined by NAV CANADA.
An itinerant movement is the initial take-off or the final landing of an aircraft.
A domestic itinerant movement is defined as a movement, at a Canadian airport, of an aircraft departing to or arriving from another point in Canada.
A local movement is an aircraft conducting the following airport activities: touch-and-go, stop-and-go, simulated approach without landing, low approach, pull up while on final approach or missed approach. Local movements are often carried out during training flights (touch-and-go), equipment tests, etc.
On July 11, 2024, the flight service station at Peace River, British Columbia, was officially closed. Since August 2024, movements for Peace River Airport are excluded from Aircraft movement statistics. Data prior to August 2024 will continue to be available.
The Monthly Civil Aviation Survey covers all Canadian Level I air carriers: Air Canada (including Air Canada Rouge), Air Transat, Flair, Jazz, Porter, Sunwing and WestJet (including WestJet Encore).
The average passenger trip length is calculated by dividing the number of passenger-kilometres by the number of passengers. Trips across Canada and around the world are included in this calculation.
The data in this monthly release are not seasonally adjusted.
Data are subject to revisions.
Contact information
For more information, or to enquire about the concepts, methods or data quality of this release, contact us (toll-free 1-800-263-1136; 514-283-8300; infostats@statcan.gc.ca) or Media Relations (statcan.mediahotline-ligneinfomedias.statcan@statcan.gc.ca).