

The standard of living from earning $75,000 in one province or territory is not the same as earning that amount in another province or territory if the cost of living differs in each location.
Regional economic disparities have been increasing in many high-income countries, leading to increased interest in the measurement of economic differences within a country. The study, "Purchasing Power Parities for Consumption and Household Income Across the Canadian Provinces and Territories," released today, provides new evidence on differences in purchasing power between Canadian provinces and territories by developing regional purchasing power parities (PPPs) for Canadian household incomes. Because this is the first time Statistics Canada has produced provincial and territorial PPPs, a methodology for PPP estimation had to be developed for the study. Since the data and results require extensive validation for each year examined, this initial study focuses on a single year, 2021.
The study begins by calculating the consumption portion of regional PPPs. PPPs are designed to adjust for differences in price level across regions and consist of differences in the prices of consumption and investment. The relative price levels in the study focus on the consumption portion (including housing cost differences) of the PPPs. These PPPs reflect differences in the amount of money needed to purchase an equivalent amount of goods and services in each province and territory.
The study identified British Columbia, Ontario and Alberta as the provinces with the highest costs of living in 2021, while Prince Edward Island and New Brunswick had the lowest costs of living. Specifically, $1.00 spent in British Columbia purchased the equivalent amount of goods and services as $0.82 spent in New Brunswick. Among the territories, Nunavut was the most expensive, and both Nunavut and the Northwest Territories were more expensive than any province. In 2021, a person in Nunavut would have needed to spend $1.10 to purchase the equivalent amount of goods and services as $1.00 could purchase in British Columbia, the most expensive province.
Following the calculation of the consumption PPPs, the study examines two measures of household income, price-adjusting these measures to examine real income across the regions in 2021. The first measure examined is household disposable income per capita. Despite high price levels in Alberta, the province still sat in the top half of the distribution of household disposal income per capita after adjusting income for prices, behind only the Northwest Territories, Yukon, and Newfoundland and Labrador. This indicates that high disposable incomes in Alberta compensated for high price levels. On the other hand, the rankings of Ontario and British Columbia in terms of household disposable income per capita were heavily affected by price adjustment, with these two provinces dropping from fourth (Ontario) and fifth (British Columbia) in terms of nominal income to eighth for Ontario and ninth for British Columbia in terms of PPP-adjusted disposable income. Manitoba and Nunavut had the lowest disposable income among the provinces and territories, but this was also true before price adjustment.
Chart 1: Household disposable income per capita (HDIPC), nominal and purchasing power parity (PPP)-adjusted, Ontario as denominator, by province or territory, 2021
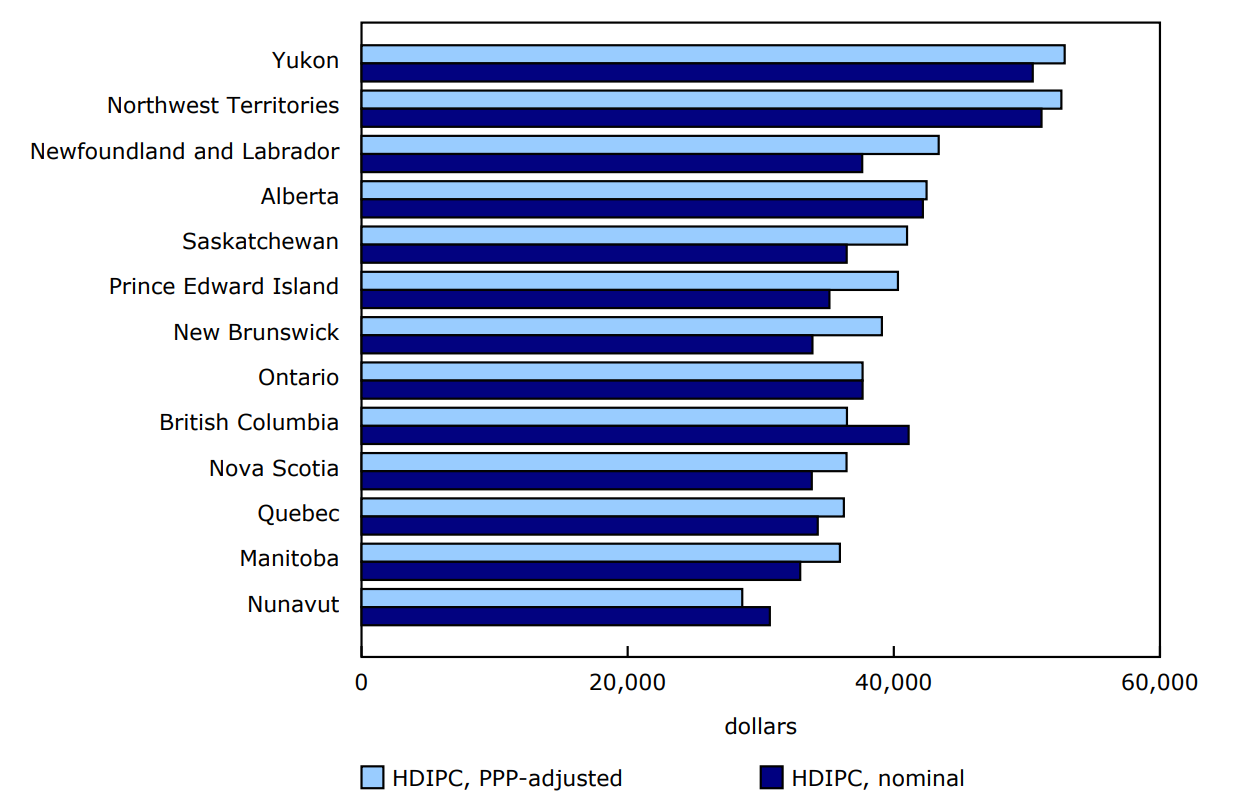
Description - Chart 1
Notes: Ontario is used as the base. Price adjustment is performed using the private purchasing power parity (PPP).
Source: Custom tabulation.
The second measure of income is household disposable income per capita plus the value of social transfers in kind, which represent publicly provided services, such as health care. After adding the value of social transfers in kind, Ontario and British Columbia fared worse, with the second lowest (Ontario) and lowest (British Columbia) price-adjusted income among all provinces and territories. Nunavut fared much better, with price-adjusted income that was above most provinces and the other two territories. Taken together, these results suggest that price adjustment and the value of publicly provided services both play an important role in understanding differences in economic well-being between regions.
Chart 2: Household disposable income per capita (HDIPC) plus imputation for social transfers in kind (STIK), nominal and purchasing power parity (PPP)-adjusted, Ontario as denominator, by province or territory, 2021
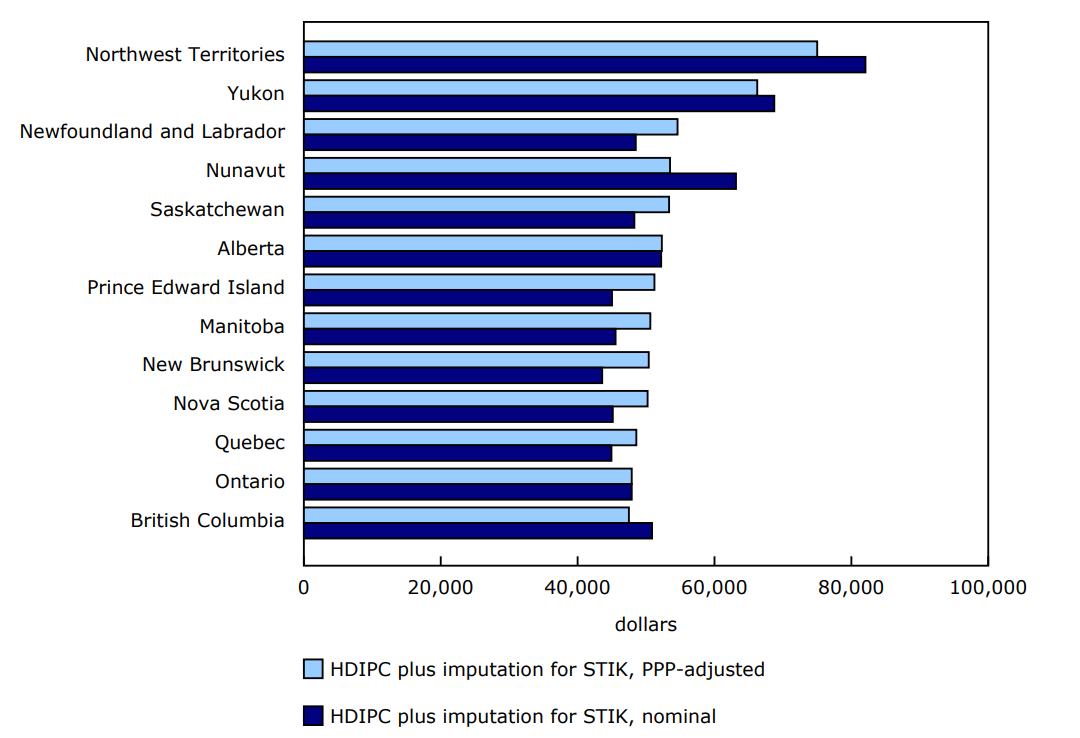
Description - Chart 2
Notes: Ontario is used as the base. Price adjustment is performed using the overall purchasing power parity (PPP).
Source: Custom tabulation.
Contact information
For more information, or to enquire about the concepts, methods or data quality of this release, contact us (toll-free 1-800-263-1136; 514-283-8300; infostats@statcan.gc.ca) or Media Relations (statcan.mediahotline-ligneinfomedias.statcan@statcan.gc.ca).