

Wholesale sales (excluding petroleum, petroleum products, and other hydrocarbons and excluding oilseed and grain) rose 0.7% to $84.7 billion in June. Sales increased in four of the seven subsectors, representing 54.2% of total wholesale sales. The largest increases came from the food, beverage and tobacco (+1.7% to $15.6 billion) and the miscellaneous (+2.4% to $10.7 billion) subsectors. Wholesale sales were 3.2% higher in June, compared with the same month one year earlier.
In volume terms, wholesale sales (excluding petroleum, petroleum products, and other hydrocarbons and excluding oilseed and grain) increased 0.6% in June.
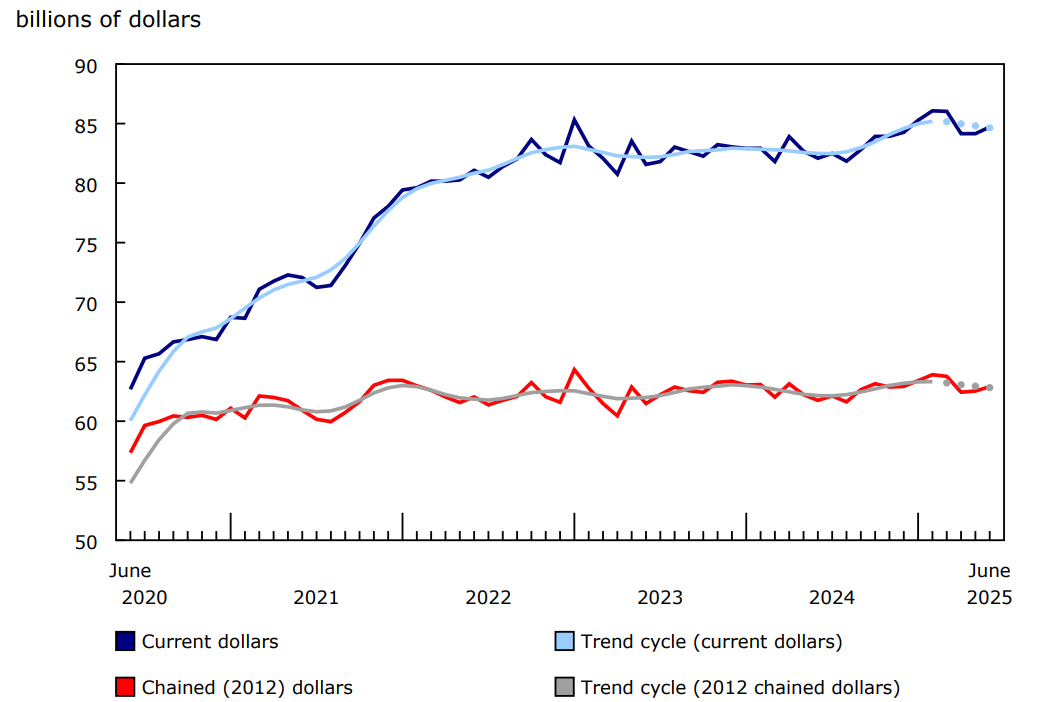
Chart 1: Wholesale sales (excluding petroleum, petroleum products, and other hydrocarbons and oilseed and grain) increase in June
Description - Chart 1
Notes: The higher variability associated with the trend-cycle estimates is indicated on the chart with a dotted line for the current reference month and the previous three months. For more information, see the Note to readers.
Sources: Tables 20-10-0074-01 and 20-10-0003-01.
Impact of Canada–US trade tensions
Feedback from respondents for June highlighted the effects of Canada–US trade tensions on Canadian wholesale businesses. Supplementary questions asked to respondents show that 33.6% of wholesale businesses were impacted by the trade tensions in June.
Wholesale sales were negatively impacted in all seven subsectors, with the machinery, equipment and supplies subsector reporting the highest percentage of impacted businesses (38.3%). The most cited impacts were price increases (22.6%) and change in demand for product (13.8%).
Food, beverage and tobacco lead sales increases in June
Sales in the food, beverage and tobacco subsector increased 1.7% to $15.6 billion in June. The increase was driven by sales in the food industry group (+1.9% to $13.9 billion).
The miscellaneous subsector posted the second-largest increase in June, with sales up 2.4% to $10.7 billion. The mineral, ore and precious metals industry group drove the increase.
The machinery, equipment and supplies subsector also contributed to higher wholesale sales in June, up 0.6% to $18.0 billion.
Quebec leads provincial sales increase
In June, six provinces reported higher wholesale sales, led by Quebec and Ontario.
Quebec led the provincial sales increase in June (+1.9% to $15.3 billion). Higher sales were reported in five of the seven subsectors, with the miscellaneous (+8.4% to $1.5 billion) and the building material and supplies (+5.3% to $2.3 billion) subsectors posting the largest gains.
Ontario posted the second-largest increase in provincial wholesale sales in June, rising 0.7% to $43.8 billion. Sales increased in five of the seven subsectors, with the food, beverage and tobacco subsector reporting the largest increase (+2.4% to $7.3 billion).
Alberta (-2.9% to $9.2 billion) posted a decline in wholesale sales in June, moderating the national increase. Sales decreased in five of the seven subsectors, with the machinery, equipment and supplies subsector (-4.3% to $2.9 billion) declining the most.
Inventories increase in June
Wholesale inventories (excluding petroleum, petroleum products, and other hydrocarbons and excluding oilseed and grain) were up 0.9% to $131.7 billion in June.
In June, the agriculture supplies industry group (+8.4%) in the miscellaneous subsector and the building material and supplies subsector (+2.1%) led the inventory increase.
The inventory-to-sales ratio was unchanged from May, at 1.55 in June. This ratio is a measure of the time (in months) required to exhaust inventories if sales were to remain at their current levels.
Wholesale sales fall in the second quarter of 2025
In the second quarter, wholesale sales (excluding petroleum, petroleum products, and other hydrocarbons and excluding oilseed and grain) fell 1.7% to $253.0 billion.
Overall, six of the seven subsectors reported lower sales in the second quarter, led by the machinery, equipment and supplies subsector (-2.5% to $54.6 billion) and the building material and supplies subsector (-3.4% to $35.4 billion).
In volume terms, wholesale sales (excluding petroleum, petroleum products, and other hydrocarbons and excluding oilseed and grain) decreased 1.7% in the second quarter.
In the second quarter, wholesale sales were 1.7% higher compared with the same quarter one year earlier.
Table 1: Wholesale merchants' sales by industry—seasonally adjusted
Table 3: Wholesale merchants' inventories by industry—seasonally adjusted
Note to readers
Wholesale (sales and inventories) values exclude petroleum, petroleum products, and other hydrocarbons and oilseed and grain unless otherwise stated.
Petroleum, petroleum products, and other hydrocarbons and oilseed and grain data continue to be available in data tables but will be excluded from monthly analysis until historical data are available.
All data in this release are seasonally adjusted and expressed in current dollars unless otherwise noted.
Seasonally adjusted data are data that have been modified to eliminate the effect of seasonal and calendar influences to allow for more meaningful comparisons of economic conditions from period to period. For more information on seasonal adjustment, see Seasonally adjusted data – Frequently asked questions.
Trend-cycle estimates are included in selected charts as a complement to the seasonally adjusted series. These data represent a smoothed version of the seasonally adjusted time series and provide information on longer-term movements, including changes in direction underlying the series. For information on trend-cycle data, see Trend-cycle estimates – Frequently asked questions.
Both seasonally adjusted data and trend-cycle estimates are subject to revision as additional observations become available. These revisions could be large and could even lead to a reversal of movement, especially for reference months near the end of the series or during periods of economic disruptions.
Total wholesale sales expressed in volume are calculated by deflating current dollar values using relevant price indexes. The wholesale sales series in chained (2012) dollars is a chained Fisher volume index, with 2012 as the reference year. For more information, see the publication "Deflation of wholesale sales."
The Monthly Wholesale Trade Survey covers all industries within the wholesale trade sector, as defined by the North American Industry Classification System (NAICS), with the exception of business-to-business electronic markets, and agents and brokers (NAICS 419).
Real-time data tables
Real-time data tables 20-10-0020-01 and 20-10-0005-01 will be updated soon.
Next release
Wholesale trade data for July will be released on September 15.
Contact information
For more information, or to enquire about the concepts, methods or data quality of this release, contact us (toll-free 1-800-263-1136; 514-283-8300; infostats@statcan.gc.ca) or Media Relations (statcan.mediahotline-ligneinfomedias.statcan@statcan.gc.ca).