
Highlights
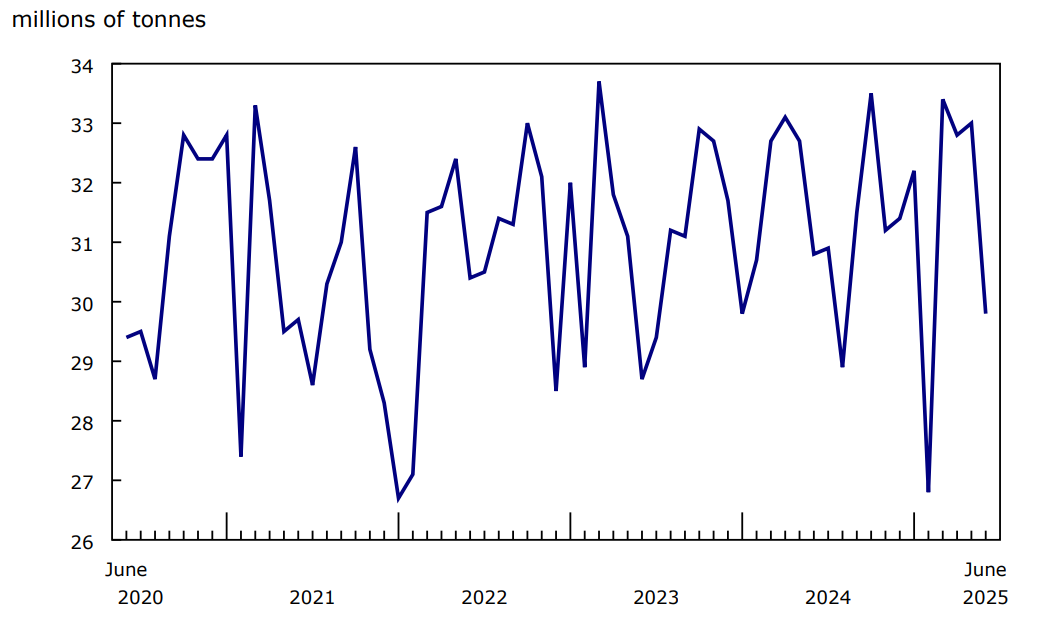
In June, the volume of cargo carried by Canadian railways reached 29.8 million tonnes, down 3.1% from June 2024.
Cargo tonnage in June 2025 was equal to the five-year monthly average, while the cumulative volume for the first half of the year was 188.0 million tonnes, down 0.9% (-1.8 million tonnes) from the same January-to-June period of 2024.
Chart 1: Railway carloadings, total tonnage
The overall traffic decrease in June was driven by lower volumes of freight from connections with American railways and non-intermodal domestic loadings (mainly commodities). Conversely, intermodal domestic loadings (mainly containers) increased in June.
Carloadings of iron ores and concentrates lead decline
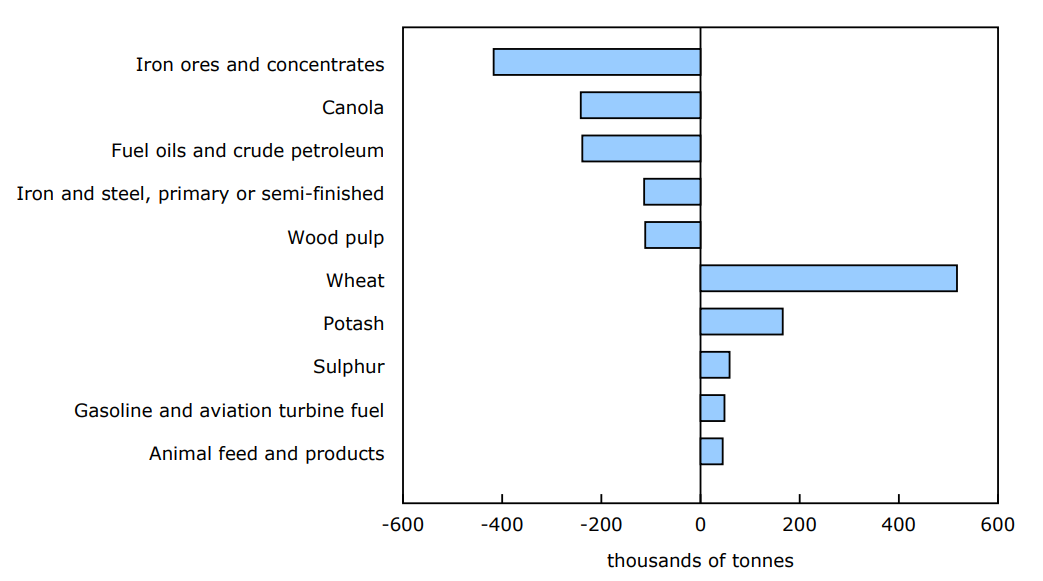
Non-intermodal freight traffic in Canada was down 2.3% year over year to 23.5 million tonnes in June. The decline was led by loadings of iron ores and concentrates—feedstock to produce steel—which were down 9.0% (-417 000 tonnes) compared with June 2024. Canadian international merchandise trade statistics reported that Canada's exports of iron and steel products fell 11.4% year over year in June 2025. This coincided with higher tariffs on Canadian steel and aluminum imposed by the United States.
In June, loadings of canola were down 25.1% (-242 000 tonnes) from June 2024 levels, while loadings of fuel oils and crude petroleum posted another year-over-year decline, falling 27.2% (-238 000 tonnes) compared with June 2024. This marked the seventh consecutive monthly year-over-year decline for fuel oils and crude petroleum.
Chart 2: Railway carloadings, largest commodity differences, June 2024 to June 2025
Description - Chart 2
Data table: Railway carloadings, largest commodity differences, June 2024 to June 2025
Source: Table 23-10-0216-02.
Carloadings of wheat and potash remain up
The decline in commodity traffic in June 2025 was moderated by increases in loadings of certain commodities, notably wheat.
Car loadings of wheat were up 24.0% (+517 000 tonnes) in June from June 2024, marking the fourth consecutive month of double-digit increases.
Year over year, loadings of potash were up 7.7% (+166 000 tonnes) in June, while loadings of sulphur were up 15.7% (+59 000 tonnes) from June 2024.
Intermodal traffic up
In June 2025, intermodal shipments—mainly containers—originating in Canada increased year over year for the fourth month in a row, up 8.7% in June to 3.2 million tonnes.
American freight traffic continues to trend downward
In June 2025, freight loadings from US rail connections totalled 3.1 million tonnes, a decline of 17.3% (-651 000 tonnes) from the same month a year earlier. This was the lowest volume recorded for the month of June in five years and the fifth consecutive month of year-over-year decreases. According to Canadian international merchandise trade data, Canada's imports (-31.7%) and exports (-17.6%) by rail with the United States in June 2025 were down significantly year over year.
Focus on Canada and the United States
Freight traffic received from US connections fell 17.3% (-651 000 tonnes) year over year to 3.1 million tonnes in June 2025, the fifth straight month of double-digit declines in tonnage.
In 2023 and 2024, traffic received from US connections represented an average 12.0% of total rail tonnage each month. During the first quarter of 2025, this proportion edged down to 10.7%, then to 10.4% in the second quarter.
Statistics Canada continues to monitor potential impacts of tariffs on railway carloading statistics.
For more data and insights on areas touched by the socio-economic relationship between Canada and the United States, see the Focus on Canada and the United States webpage.
Note to readers
The Monthly Railway Carloadings Survey collects data on the number of rail cars, tonnage, units and 20-feet equivalent units from railway transporters operating in Canada that provide for-hire freight services.
Cargo loadings from Armstrong, Ontario, to the Atlantic Coast are classified to the eastern division (Eastern Canada), while loadings from Thunder Bay, Ontario, to the Pacific Coast are classified to the western division (Western Canada).
Survey data are revised on a monthly basis to reflect new information.
The data in this release are not seasonally adjusted.
The Transportation Data and Information Hub, featuring data from Statistics Canada, Transport Canada and partners, provides Canadians with online access to comprehensive statistics and indicators for the country's transportation sector.
Contact information
For more information, or to enquire about the concepts, methods or data quality of this release, contact us (toll-free 1-800-263-1136; 514-283-8300; infostats@statcan.gc.ca) or Media Relations (statcan.mediahotline-ligneinfomedias.statcan@statcan.gc.ca).