

Highlights
Major Canadian airlines flew 7.5 million passengers on scheduled and charter services in June, up 0.7% from June 2024.
Aircraft movements at Canada's major and select small airports totalled 563,211 in June 2025, up 8.2% from one year earlier. Year over year, itinerant movements were up 6.2%, while local movements rose 13.1%.
Consult the Aviation Data Visualization Hub to explore aircraft movement statistics and monthly civil aviation statistics in an interactive format.
Passenger load factor waning
Canadian Level I air carriers flew 7.5 million passengers on scheduled and charter services in June, 0.7% more than in June 2024.
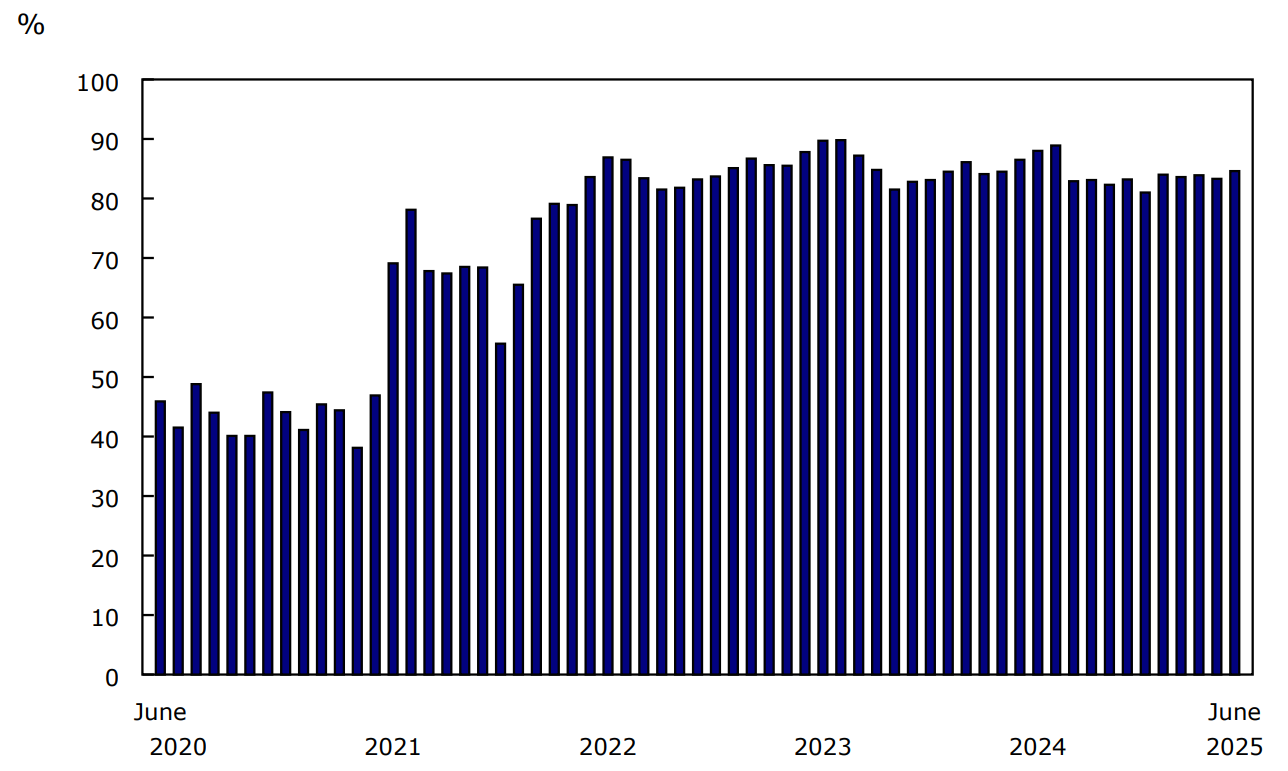
The number of passenger-kilometres increased 2.0% year over year to 21.4 billion in June 2025, while capacity was up 4.3% to 25.3 billion available seat-kilometres. As a result, the passenger load factor (the ratio of passenger-kilometres to available seat-kilometres) declined to 84.6% in June, from 86.5% in June 2024. The load factor has been below that of the same period one year earlier for each month in the first half of 2025.
Chart 1: Passenger load factor, Canadian air carriers, Level I
Description - Chart 1
Data table: Passenger load factor, Canadian air carriers, Level I
Source: Table 23-10-0079-01.
Each passenger travelled an average of 2,832 kilometres in June 2025, up 1.3% from the same month a year earlier.
Level I carriers flew 194,000 hours (+3.7%) in June and generated $2.7 billion (+2.3%) in total operating revenue.
Local movements and domestic itinerant movements continue to rise
In June, flight school activity at Canada's major and select small airports contributed to the increase in local aircraft movements (+13.1% year over year to 173,076 movements) for the fourth consecutive month. The airports with the largest increases were Pitt Meadows (+2,588 movements), Kitchener/Waterloo (+2,152) and Toronto/Billy Bishop Toronto City (+2,150).
Chart 2: Total aircraft movements at major and select small airports, by class of operation

Description - Chart 2
Data table: Total aircraft movements at major and select small airports, by class of operation
Source: Table 23-10-0296-01.
Meanwhile, domestic itinerant movements increased 7.3% compared with June 2024 to 335,418 in June 2025. Increases were recorded in nine provinces and territories, with the largest gains in Ontario (+9,001 movements) and British Columbia (+7,570). Other international traffic (outside the United States) grew 7.6% from the same month of the previous year to 16,661.
Transborder movements (to and from the United States) continued to decline in June, down 2.5% year over year to 38,056 movements.
Wildfires burn across the country
In mid-June, the Government of Canada released an assessment indicating elevated fire risk across several regions of the country for the summer of 2025. The Canadian Interagency Forest Fire Centre reported that wildfires had burned 4.2 million hectares across Canada by the end of June 2025, more than five times the size recorded in the same period one year earlier. This contributed to higher aircraft movements as aircraft were used for wildfire response. Total aircraft movements increased significantly in Pickle Lake, Ontario (2,668 total movements; +107.1%), La Ronge, Saskatchewan (1,903 movements; +55.6%) and The Pas, Manitoba (664 movements; +122.1%).
Focus on Canada and the United States
Transborder aircraft movements (to and from the United States) represented 9.8% of total itinerant movements at Canada's major and select small airports in June, down from 10.6% in June 2024.
In June 2025, year-over-year declines in movements to and from the United States were recorded at two of the four largest Canadian airports: Toronto/Lester B. Pearson International (-2.9%) and Montréal/Pierre Elliot Trudeau International (-6.4%). In contrast, Vancouver International (+5.7%) and Calgary International (+6.1%) posted year-over-year increases in transborder movements.
Meanwhile, the number of passengers carried by Canadian Level I air carriers on scheduled transborder flights in June was 9.9% below the level recorded in the same month of the previous year. This represented the fifth consecutive month of year-over-year declines, but a smaller decrease compared with those observed in April and May. In June, the capacity of these flights, measured in available seat-kilometres, declined year over year for the third consecutive month, down 5.9% from June 2024. This was the largest of the three declines. The passenger load factor on scheduled transborder flights decreased from 84.9% in June 2024 to 80.7% in June 2025, an improvement from May.
For more data and insights on areas touched by the socio-economic relationship between Canada and the United States, see the Focus on Canada and the United States webpage.
Note to readers
This consolidated monthly release covers the following statistical programs:
- Aircraft movement statistics (survey number 2715, tables 23-10-0296-01 to 23-10-0304-01)
- Monthly civil aviation statistics (survey number 5026, table 23-10-0079-01).
Consult the Aviation Data Visualization Hub to explore data from Aircraft movement statistics and Monthly civil aviation statistics in an interactive format.
The aviation statistics program uses respondent (Monthly civil aviation statistics) and administrative (Aircraft movement statistics) data.
An aircraft movement is defined as a take-off, landing or simulated approach by an aircraft, as defined by NAV CANADA.
An itinerant movement is the initial take-off or the final landing of an aircraft.
A domestic itinerant movement is defined as a movement, at a Canadian airport, of an aircraft departing to or arriving from a point in Canada.
A local movement is an aircraft conducting the following airport activities: touch-and-go, stop-and-go, simulated approach without landing, low approach, pull up while on final approach or missed approach. Local movements are often carried out during training flights (touch-and-go), equipment tests, etc.
On July 11, 2024, the flight service station at Peace River, British Columbia, was officially closed. Since August 2024, movements for Peace River Airport are excluded from Aircraft movement statistics. Data prior to August 2024 will continue to be available.
On June 2, 2025, Stephenville Airport in Newfoundland and Labrador was closed. Since June 2025, movements for Stephenville Airport are excluded from Aircraft movement statistics. Data prior to June 2025 will continue to be available.
The Monthly Civil Aviation Survey covers all Canadian Level I air carriers: Air Canada (including Air Canada Rouge), Air Transat, Flair, Jazz, Porter and WestJet (including WestJet Encore). As of June 2025, Sunwing Airlines was fully integrated into WestJet.
The average passenger trip length is calculated by dividing the number of passenger-kilometres by the number of passengers. Trips across Canada and around the world are included in this calculation.
The data in this monthly release are not seasonally adjusted.
Data are subject to revisions.
Contact information
For more information, or to enquire about the concepts, methods or data quality of this release, contact us (toll-free 1-800-263-1136; 514-283-8300; infostats@statcan.gc.ca) or Media Relations (statcan.mediahotline-ligneinfomedias.statcan@statcan.gc.ca).