
Highlights
In July, 5.8 million passengers were recorded passing through pre-board security screening at checkpoints operated at Canada's eight largest airports, a 3.6% increase over July 2024, and 7.8% higher than the pre-COVID-19 pandemic level from July 2019.
International traffic up while transborder traffic weakens further
In July 2025, 1.6 million passengers were screened for international flights (outside the United States), up 9.4% year over year. Moreover, international traffic was significantly higher (+12.3%) than the pre-pandemic level recorded in July 2019.
Conversely, in July 2025, transborder passenger traffic (to the United States) decreased year over year for the sixth consecutive month, down 7.8% to 1.5 million, albeit on par (+0.5%) with the pre-pandemic level in July 2019.
Domestic passenger traffic was 2.8 million in July 2025, 7.3% higher than in July 2024 and surpassing (+9.4%) the passenger counts recorded in July 2019.
Chart 1: Number of screened passengers at the eight largest airports in Canada, monthly, 2020 to 2025

Description - Chart 1
Data table: Number of screened passengers at the eight largest airports in Canada, monthly, 2020 to 2025
Source: Table 23-10-0312-01.
Passenger traffic up at all airports
In July 2025, Canada's eight largest airports posted higher volumes of passenger traffic year over year. Ottawa/Macdonald-Cartier International (+10.4%) posted the largest increase over July 2024.
In terms of a post-pandemic recovery, seven of these eight major airports exceeded their July 2019 pre-pandemic volumes of screened passenger traffic in July 2025. Indeed, only Ottawa/Macdonald-Cartier International (-2.7% compared with July 2019) posted a lower volume of screened passenger traffic.
Chart 2: Number of screened passengers at the eight largest airports in Canada by sector, July, 2019 to 2025
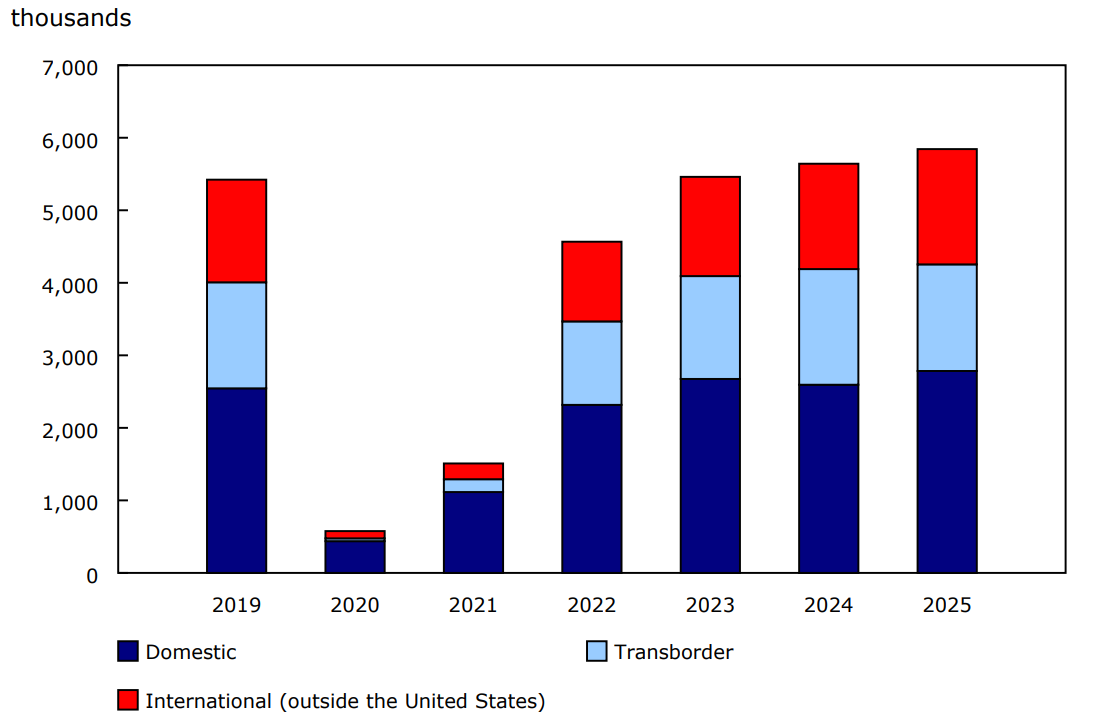
Description - Chart 2
Data table: Number of screened passengers at the eight largest airports in Canada by sector, July, 2019 to 2025
Source: Table 23-10-0312-01.
Chart 3: Year-over-year percentage change in monthly screened passengers, by sector, 2025

Description - Chart 3
Data table: Year-over-year percentage change in monthly screened passengers, by sector, 2025
Source: Table 23-10-0312-01.
Focus on Canada and the United States
In July 2025, transborder passengers accounted for 25.2% of the total number of screened passengers, down from 28.3% in July 2024.
Transborder traffic is typically concentrated at the four largest Canadian airports: Toronto/Lester B. Pearson International, Vancouver International, Montréal/Pierre Elliott Trudeau International and Calgary International. Combined, these four airports represent more than 90% of all transborder traffic.
In July 2025, all four airports recorded year-over-year decreases in screened passenger counts for flights to the United States: Toronto/Lester B. Pearson International (-11.9%), Vancouver International (-2.7%), Montréal/Pierre Elliott Trudeau International (-7.9%) and Calgary International (-2.1%).
Note that screened passengers include both Canadian and non-Canadian residents.
For preliminary numbers of arrivals to Canada from the United States by air and automobile, see the Leading indicator of international arrivals to Canada, July 2025.
For more data and insights on areas touched by the socioeconomic relationship between Canada and the United States, see the Focus on Canada and the United States webpage.
Note to readers
Data for this release are derived from the Canadian Air Transport Security Authority (CATSA) Boarding Pass Security System and include screened traffic at pre-board security screening checkpoints at the eight largest airports in Canada.
The eight largest airports in Canada are Halifax/Robert L. Stanfield International, Montréal/Pierre Elliott Trudeau International, Ottawa/Macdonald-Cartier International, Toronto/Lester B. Pearson International, Winnipeg/James Armstrong Richardson International, Calgary International, Edmonton International and Vancouver International.
Screened passenger traffic includes air travellers required to go through pre-board security screening and excludes aircrew and airport employees. This data series represents a different measure of traffic than the counts of enplaned or deplaned passengers published in Statistics Canada's annual Airport activity report or produced by the individual airports. For example, the screened passenger data will not account for passengers with connecting flights who did not pass through security. For more information, please refer to the "Related information" tab (Definitions, data sources and methods) for this release.
Users interested in accessing daily counts of screened traffic at Canada's major airports can obtain them from the CATSA website.
Contact information
For more information, or to enquire about the concepts, methods or data quality of this release, contact us (toll-free 1-800-263-1136; 514-283-8300; infostats@statcan.gc.ca) or Media Relations (statcan.mediahotline-ligneinfomedias.statcan@statcan.gc.ca).