

In August, prices of products manufactured in Canada, as measured by the Industrial Product Price Index (IPPI), increased 0.5% month over month and gained 4.0% year over year. At the same time, prices of raw materials purchased by manufacturers operating in Canada, as measured by the Raw Materials Price Index (RMPI), declined 0.6% month over month and rose 3.2% year over year.
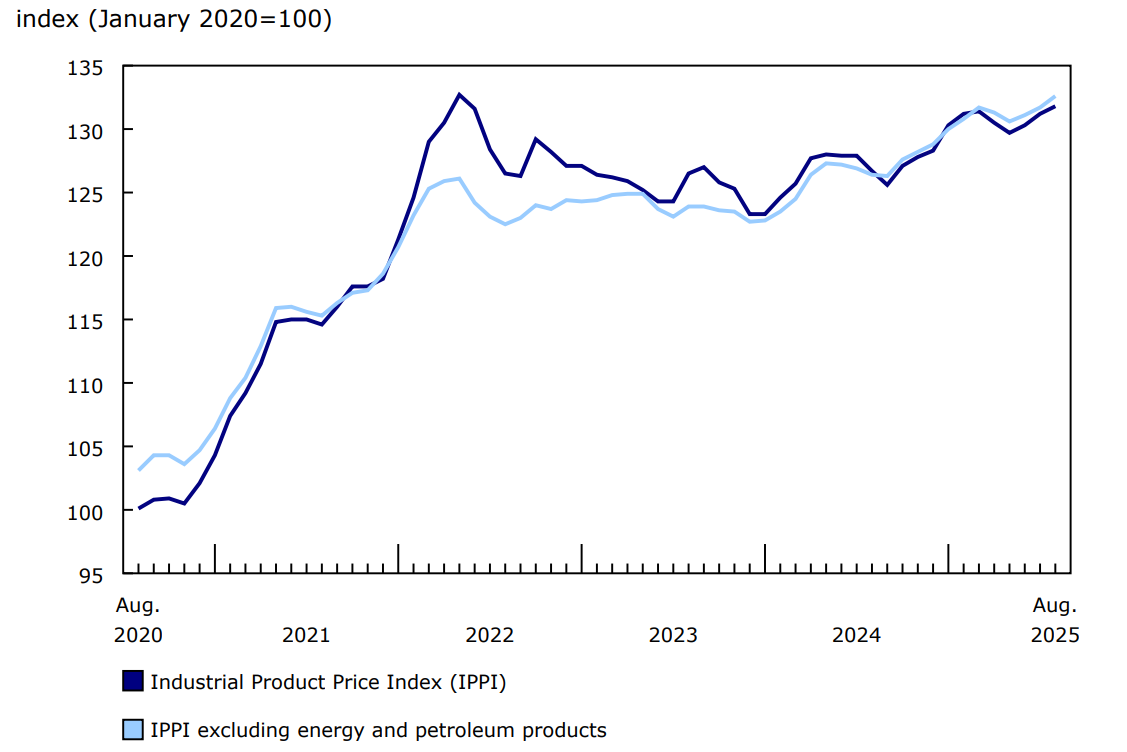
Chart 1: Prices for industrial products increase in August
Description - Chart 1
Data table: Prices for industrial products increase in August
Source: Table 18-10-0265-01.
Industrial Product Price Index
The IPPI increased 0.5% month over month in August. Higher prices for chemicals and chemical products, meat, fish and dairy products, motorized and recreational vehicles, and primary non-ferrous metal products contributed the most to the increase of the index. Lower prices for energy and petroleum products moderated the increase. Excluding energy and petroleum products, the IPPI increased 0.7% in August.
Prices for meat, fish and dairy products rose for the ninth straight month in August, up 1.9% in the month. The increase was mainly driven by price movements for fresh and frozen beef and veal (+5.2%) and fresh and frozen chicken (+2.1%). This was the largest monthly increase for fresh and frozen beef and veal since June 2024. Beef and chicken prices rose in August 2025 due to ongoing strong seasonal demand for and tight domestic supply of poultry and cattle. Cattle supply has been hindered in recent years by drought conditions in Canada's Prairie region. Poultry prices have been impacted by recent bird flu outbreaks from major poultry-exporting countries.
Prices for primary non-ferrous metal products rose 1.0% from July to August. The increase was driven by higher prices for unwrought gold, silver and platinum group metals, and their alloys (+0.7%). While unwrought platinum group metals, and their alloys decreased 3.7% in August after three consecutive months of strong increases, price gains were observed for unwrought gold and gold alloys (+1.6%) as well as unwrought silver and silver alloys (+1.9%), leading to an overall increase for the commodity group. Gold and silver prices posted gains as market participants anticipated that the United States Federal Reserve would cut interest rates in September.
The prices of energy and petroleum products were the main moderator of the IPPI's monthly increase in August, falling 1.3% relative to July. Lower prices for conventional crude oil (-3.9%) in August drove a decline in prices for refined petroleum energy products (-1.5%), as crude oil is the primary production input for such products. Prices of diesel fuel (-6.0%) decreased, while prices of finished motor gasoline (+1.8%) increased. Gasoline prices rose from July to August amid strong demand during the peak of the summer driving season.
Year over year
The IPPI gained 4.0% year over year in August, the index's 11th straight year-over-year increase.
Unwrought gold, silver, and platinum group metals, and their alloys (+36.3%) led the IPPI's year-over-year gain in August. High prices for precious metals were supported by strong safe-haven investment demand over the 12 months ending in August. Other key upward contributors included fresh and frozen beef and veal (+28.9%) and fresh and frozen poultry of all types (+18.4%).
Among the subgroups registering year-over-year declines in August, finished motor gasoline (-5.4%) had the greatest moderating impact on the IPPI's upward year-over-year movement. Despite this subgroup's month-over-month gain in August 2025, finished motor gasoline prices were higher in August 2024 than they were at any point over the following 12 months, leading to the year-over-year decrease in August 2025.
Raw Materials Price Index
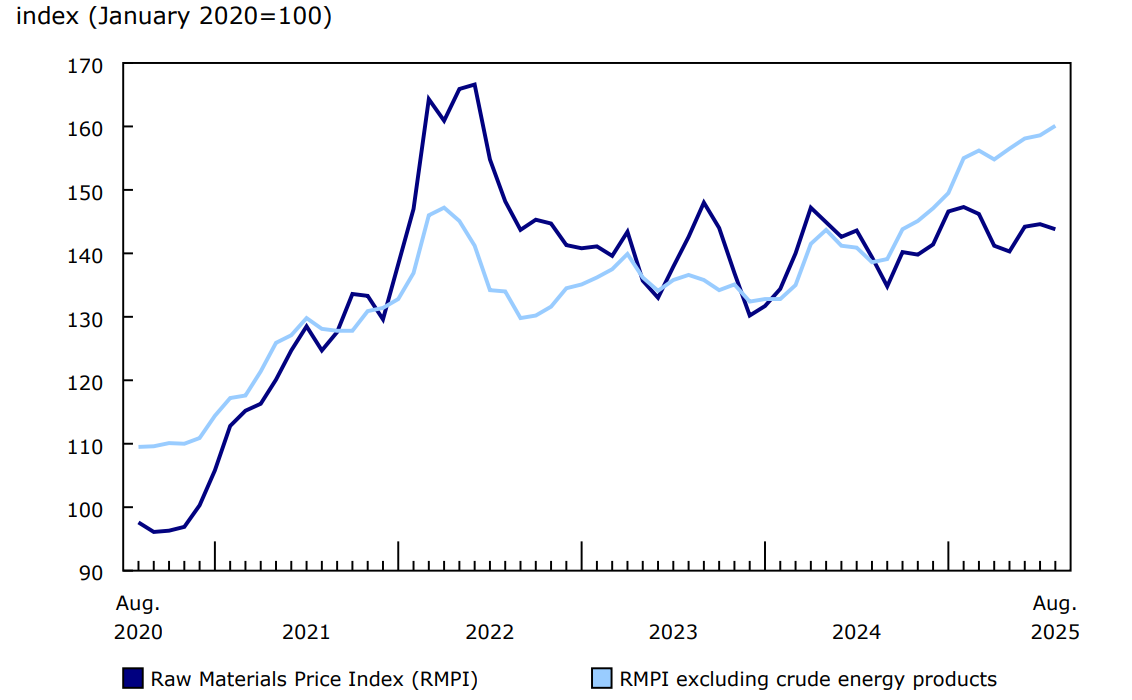
The RMPI declined 0.6% month over month in August. Excluding crude energy products, the RMPI increased 0.9%.
Prices for crude energy products fell 3.7% in August. Price declines were observed for both conventional crude oil (-3.5%) and synthetic crude oil (-5.1%). Fears of a supply glut in the global crude market exerted downward pressure on prices, particularly as OPEC+ (the Organization of the Petroleum Exporting Countries and its partners) announced a substantial increase to its September production target on August 3.
In August, the prices of metal ores, concentrates and scrap increased 2.0% relative to July. Higher prices for gold, silver, and platinum group metal ores and concentrates (+2.1%) drove the increase in August, posting their 12th straight monthly gain. Prices rose for both gold ores, concentrates and mill bullion (+2.0%) and silver ores, concentrates and mill bullion (+2.3%).
Prices for crop products dropped 1.7% in August, driven by a decrease in canola (including rapeseed) prices (-6.4%). This decline was partly due to Chinese tariffs imposed on Canadian canola seed, effective August 14, which have worsened the demand outlook for Canada's biggest canola seed export market.
Year over year
The RMPI rose 3.2% on a yearly basis in August. Excluding crude energy products, the RMPI posted a 15.5% year-over-year rise in August.
The RMPI's year-over-year increase in August was headlined by gains for gold, silver, and platinum group metal ores and concentrates (+37.0%) and cattle and calves (+19.9%). The year-over-year increase in cattle prices was largely the result of ongoing domestic supply shortages.
In August, prices notably declined on a year-over-year basis for conventional crude oil (-16.2%) and synthetic crude oil (-16.6%), largely moderating the RMPI's year-over-year increase. Crude prices have experienced several monthly declines in 2025, in part due to strong supply.
Chart 2: Prices for raw materials decrease in August
Description - Chart 2
Data table: Prices for raw materials decrease in August
Source: Table 18-10-0268-01.
Note to readers
The Industrial Product Price Index (IPPI) and the Raw Materials Price Index (RMPI) are available at the Canada level. Selected commodity groups within the IPPI are also available by region.
With each release, data for the previous six months may have been revised. The indexes are not seasonally adjusted.
The IPPI reflects the prices that producers in Canada receive as goods leave the factory gate. The IPPI does not reflect what the consumer pays. Unlike the Consumer Price Index, the IPPI excludes indirect taxes, such as sales taxes and tariffs, and all costs that occur between the time a good leaves the plant and the time the final user takes possession of the good. This includes transportation, wholesale and retail costs. Although the IPPI does not measure the direct effect of tariffs on prices, tariffs may indirectly influence prices measured in the IPPI. For example, inputs used in the production process that are imported and on which Canada imposes a tariff may raise the prices charged by Canadian producers. Tariffs on Canadian imports or exports may also indirectly influence prices in the IPPI through their impact on supply and demand dynamics.
Canadian producers export many goods. Canadian producers often indicate goods' prices in foreign currencies, especially in US dollars, which are then converted into Canadian dollars. This is particularly the case for motor vehicles, pulp and paper products, and wood products. Therefore, fluctuations in the value of the Canadian dollar against its US counterpart affect the IPPI. However, the conversion to Canadian dollars reflects only how respondents provide their prices. This is not a measure that takes into account the full effect of exchange rates.
The conversion of prices received in US dollars is based on the average monthly exchange rate established by the Bank of Canada and available in Table 33-10-0163-01 (series v111666275). Monthly and annual variations in the exchange rate, as described in this release, are calculated according to the indirect quotation of the exchange rate (for example, CAN$1 = US$X).
The RMPI reflects the prices paid by Canadian manufacturers for key raw materials. The RMPI includes all charges purchasers incur to bring a commodity to the establishment gate, including transportation charges, net taxes paid and customs duties and tariffs paid on imported raw materials. Many of the prices measured by the RMPI are set on the world market. However, as few prices are denominated in foreign currencies, their conversion into Canadian dollars has only a minor effect on the calculation of the RMPI.
Next release
The industrial product and raw materials price indexes for September will be released on October 20.
Contact information
For more information, or to enquire about the concepts, methods or data quality of this release, contact us (toll-free 1-800-263-1136; 514-283-8300; infostats@statcan.gc.ca) or Media Relations (statcan.mediahotline-ligneinfomedias.statcan@statcan.gc.ca).