

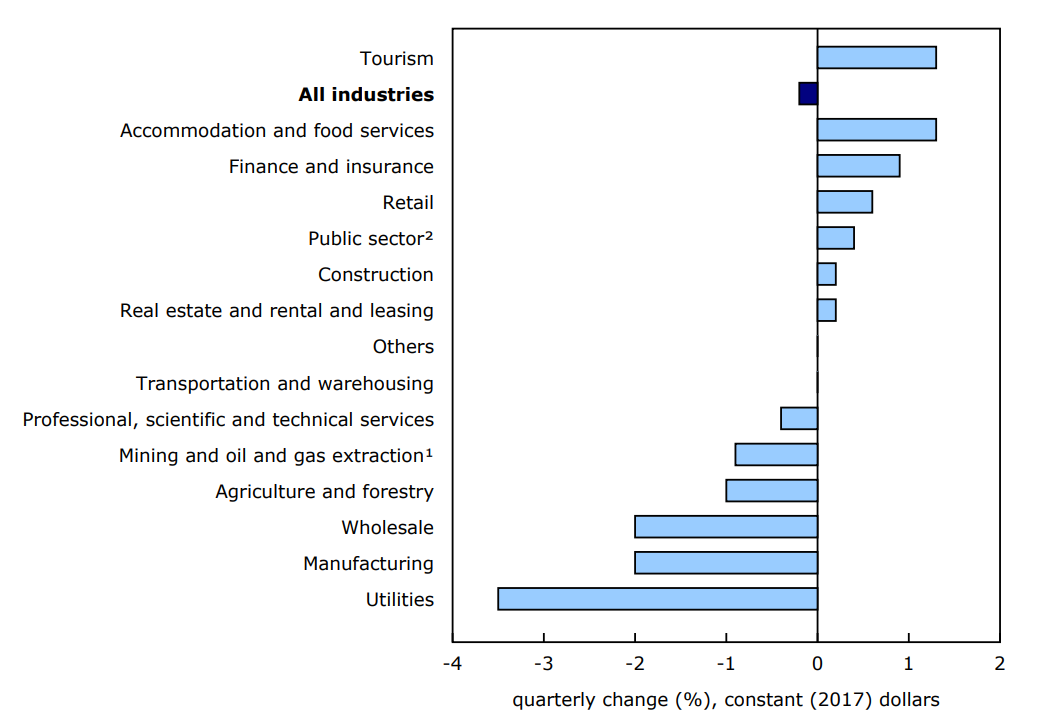
Tourism gross domestic product (GDP), in real terms, grew 1.3% in the second quarter of 2025, compared with a 0.3% increase in the first quarter. Tourism GDP growth outpaced that of most sectors in the second quarter. By comparison, economy-wide real GDP by industry was down 0.2% in the second quarter, following a 0.4% increase in the first quarter.
In the second quarter, tourism GDP accounted for 1.77% of nominal GDP, compared with 1.75% in the previous quarter.
Chart 1: Tourism and major industrial sectors, gross domestic product, second quarter of 2025
Description - Chart 1
Data table: Tourism and major industrial sectors, gross domestic product, second quarter of 2025
- Includes quarrying.
- Educational services, health care and social assistance, and public administration.
Note: Data are adjusted for seasonal variations and price changes.
Sources: Tables 36-10-0449-01 and 36-10-0234-01.
Tourism gross domestic product strengthens on increased accommodation services
Growth in tourism GDP in the second quarter of 2025 (+1.3%) was driven by gains in accommodation services (+2.4%), with all other industry groups increasing as well.
Food and beverage services was up 1.0% in the second quarter, the same rate as in the previous quarter. Transportation grew 0.9%, reversing the decline recorded in the first quarter (-0.7%). Non-tourism industries (+0.7%) strengthened in the second quarter, more than doubling the pace of the first quarter (+0.3%).
Total tourism spending rises bolstered by domestic tourism spending
Total tourism spending increased 0.9% in the second quarter of 2025, after decreasing 0.2% in the first quarter. The increase was attributable to strong domestic tourism spending (+2.9%) in the second quarter, compared with an increase of 0.3% in the first quarter.
Tourism spending by international visitors falls, as Canada welcomes fewer US visitors
The gain in total tourism spending in the second quarter of 2025 was restricted by a substantial decline in tourism expenditures by international visitors in Canada (-5.3%), also referred to as tourism exports. This followed a 1.7% drop in the first quarter.
All products registered declines in the second quarter, with non-tourism products (-8.7%), accommodation (-5.1%) and food and beverage services (-6.5%) contributing the most to weaker tourism exports.
Overnight travel to Canada by international visitors was down 6.9% in the second quarter, while overnight travel from the United States fell 10.2%.
Chart 2: Share of tourism spending in Canada by international visitors declines
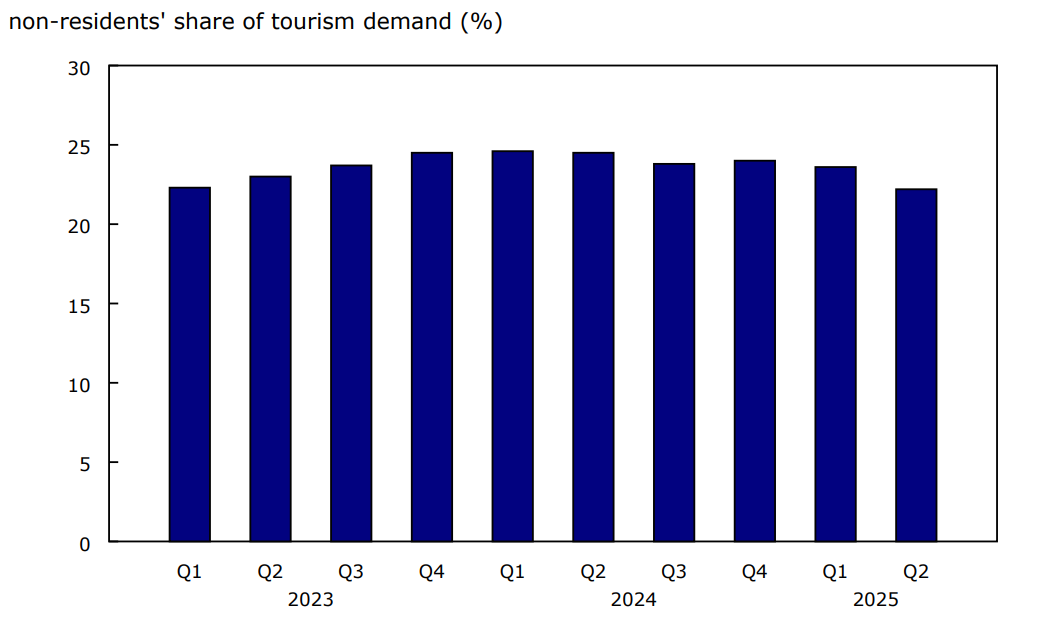
Description - Chart 2
Data table: Share of tourism spending in Canada by international visitors declines
Note: Data are adjusted for seasonal variations and price changes.
Source: Table 36-10-0230-01.
Tourism spending in Canada by Canadian residents rises, as Canadian overnight travel to United States tumbles
Tourism spending in Canada by Canadian residents was up a notable 2.9% in the second quarter of 2025, after increasing 0.3% in the previous quarter. This increase in tourism spending coincides with a 13.0% decline in Canadians returning from overnight trips to the United States, as many Canadian residents are choosing to travel domestically rather than to the United States. According to the Canadian Survey of Consumer Expectations for the second quarter, 34.8% of Canadians planned on spending more while vacationing in Canada, and 55.1% of Canadians planned on spending less while vacationing in the United States.
The increase in domestic tourism spending in the second quarter was driven by spending on accommodation services (+6.5%), non-tourism products (+4.2%) and food and beverage services (+3.9%).
Travel services (-5.5%) and vehicle rental (-2.2%) were the only tourism products that registered declines in spending in the second quarter.
Domestic tourism spending includes tourism spending by Canadian residents on Canadian goods and services, even if these goods and services are for travel outside of Canada. For example, airfares on Canadian carriers to travel outside of the country.
Jobs attributable to tourism increase in the second quarter
The number of jobs attributable to tourism increased 0.6% in the second quarter of 2025, following a 0.2% gain in the first quarter.
Almost all industries posted job gains in the second quarter, with food and beverages services (+0.8%), recreation and entertainment (+1.4%) and non-tourism industries (+0.7%) contributing the most. However, job growth in accommodation services was flat in the second quarter. While the total number of tourism jobs in Canada increased 0.6%, reaching 712,100, the number of jobs in the total economy (+0.2%) rose at a slower pace. As a result, tourism's share of economy-wide jobs grew from 3.32% to 3.34%.
Chart 3: Tourism spending, tourism gross domestic product and jobs attributable to tourism
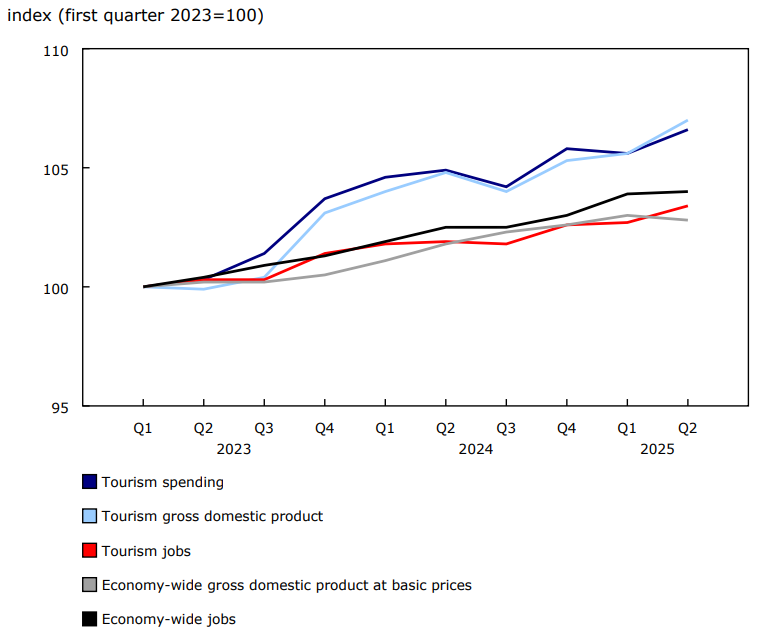
Description - Chart 3
Data table: Tourism spending, tourism gross domestic product and jobs attributable to tourism
Notes: Data are adjusted for seasonal variations. Tourism spending, tourism gross domestic product and economy-wide gross domestic product are adjusted for price changes.
Sources: Tables 36-10-0207-01, 36-10-0230-01, 36-10-0232-01, 36-10-0234-01 and 36-10-0449-01.
Looking ahead
The number of arrivals by air by non-residents increased year over year in July and August 2025, while the number of arrivals by land decreased, according to leading indicators of Frontier Counts data. The number of Canadian travellers returning by air and by land declined in July and August.
Government revenue attributable to tourism increases in 2024
Tourism is an important source of revenue for all levels of government. In 2024, it contributed $32.7 billion to government revenue, up 5.1% from 2023. Federal, provincial and territorial governments collected 94.2% of the total government revenue generated by tourism in 2024. The remainder was collected by municipal and Indigenous general governments. Domestic tourism spending accounted for about three-quarters (75.8%) of the government revenue attributable to tourism in 2024, with the remainder coming from tourism exports, which represent international visitors in Canada.
Taxes on tourism products sold to final consumers ($16.7 billion), such as the goods and services tax and the harmonized sales tax, were the largest source of government revenue attributable to tourism in 2024, followed by corporate and individual income tax ($7.7 billion) related to tourism business incomes and tourism employment.
Every $100 spent by Canadian tourists in Canada generated, on average, $25.14 in government revenue in 2024, while $25.46 was generated for each $100 spent by non-resident tourists. Overall, every $100 in tourism spending generated $25.21 in government revenue, up 0.8% from 2023.
Note to readers
With the second quarter 2025 release of the national tourism indicators, data for the first quarter of 2025 have been revised.
Gross domestic product (GDP) expressed in real and nominal terms is all at basic prices, unless otherwise specified.
Unless otherwise stated, the term tourism GDP refers to the price-adjusted or real measure of GDP.
Growth rates for tourism spending and GDP are expressed in real terms (that is, adjusted for price changes), using reference year 2017, as well as adjusted for seasonal variations, unless otherwise indicated.
Tourism jobs data are also seasonally adjusted.
Tourism's share of economy-wide GDP is calculated from seasonally adjusted nominal values.
Tourism's share of economy-wide jobs is calculated using seasonally adjusted values.
Economy-wide GDP is obtained from table 36-10-0449-01. Economy-wide total number of jobs is obtained from table 36-10-0207-01. Travel to Canada by international visitors and travel by Canadians returning to Canada are obtained from table 24-10-0054-01.
For information on seasonal adjustment, see Seasonally adjusted data – Frequently asked questions.
Associated percentage changes are presented at quarterly rates unless otherwise noted.
Non-tourism industries, also referred to as other industries, are industries that would continue to exist in the absence of tourism. For example, retail trade industries, which benefit from tourism activity, would not cease to exist in the absence of tourism. Tourism GDP takes into account the goods and services produced by these other industries and purchased by tourists.
Non-tourism products, also referred to as other products, are products for which a significant part of its total demand in Canada does not come from visitors, such as groceries, clothing and alcoholic beverages bought in stores.
The national tourism indicators are funded by Destination Canada.
The Contribution of Tourism in 2024: Jobs and Economic Growth Across Canada, an infographic by Destination Canada and Statistics Canada, summarizes the wide range of economic and societal contributions of the tourism sector.
Next release
Data on the national tourism indicators for the third quarter of 2025 will be released on January 6, 2026.
Contact information
For more information, or to enquire about the concepts, methods or data quality of this release, contact us (toll-free 1-800-263-1136; 514-283-8300; infostats@statcan.gc.ca) or Media Relations (statcan.mediahotline-ligneinfomedias.statcan@statcan.gc.ca).