

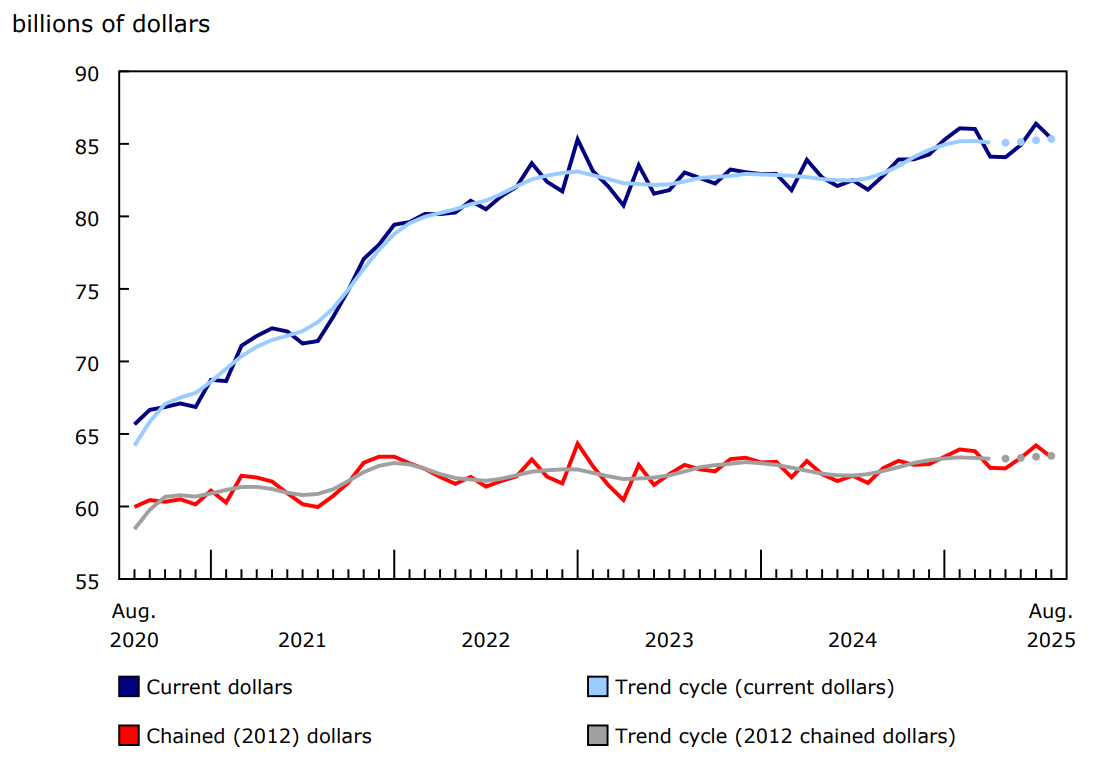
Wholesale sales (excluding petroleum, petroleum products, and other hydrocarbons and excluding oilseed and grain) declined 1.2% to $85.4 billion in August. Sales decreased in three of the seven subsectors, which represent about half of the wholesale sector. The largest decreases came from the motor vehicle and motor vehicle parts and accessories subsector (-8.8%) and the food, beverage and tobacco subsector (-3.8%). Wholesale sales were 4.3% higher in August compared with the same month one year earlier.
In volume terms, wholesale sales (excluding petroleum, petroleum products, and other hydrocarbons and excluding oilseed and grain) decreased 1.3% in August.
Chart 1: Wholesale sales (excluding petroleum, petroleum products, and other hydrocarbons and oilseed and grain) decrease in August
Description - Chart 1
Note: The higher variability associated with the trend-cycle estimates is indicated on the chart with a dotted line for the current reference month and the previous three months. For more information, see the Note to readers.
Sources: Tables 20-10-0074-01 and 20-10-0003-01.
Motor vehicle and motor vehicle parts and accessories posts largest sales decline in August
Sales in the motor vehicle and motor vehicle parts and accessories subsector decreased 8.8% to $14.0 billion in August. The decrease was driven by lower sales in the motor vehicle industry group (-10.7% to $11.1 billion).
The food, beverage and tobacco subsector posted the second-largest decline in August, with sales decreasing 3.8% to $15.6 billion. This reduction was primarily concentrated in the food industry group (-4.2% to $13.8 billion).
The decrease in wholesale sales in August was partly offset by an increase in the miscellaneous subsector (+4.0% to $11.1 billion), which was concentrated in the agricultural supplies industry group (+9.1%) and the mineral, ore and precious metals industry group (+17.1%).
The machinery, equipment and supplies subsector (+2.3% to $18.4 billion) also moderated the overall decline in August, driven by higher sales in the farm, lawn and garden machinery and equipment industry group (+18.7%).
Ontario leads provincial sales decrease
In August, seven provinces reported having lower sales, and Ontario recorded the largest decrease.
After recording three consecutive monthly increases, Ontario posted a decline in sales of 2.4% to $43.8 billion in August. Lower sales were recorded in four of the seven subsectors, with the motor vehicle and motor vehicle parts and accessories subsector (-8.7% to $9.5 billion) contributing the most to the decrease.
Quebec posted the second-largest decline in sales in August, down 1.0% to $15.3 billion. Sales decreased in three of the seven subsectors, with the motor vehicle and motor vehicle parts and accessories subsector (-11.2% to $1.9 billion) reporting the largest decline.
In contrast, the largest increase at the provincial level in August came from Saskatchewan, where sales rose 9.6% to $3.9 billion. Higher sales were primarily observed in the miscellaneous subsector (+15.3%), more specifically in the agricultural supplies industry group.
Inventories increase in August
Wholesale inventories (excluding petroleum, petroleum products, and other hydrocarbons and excluding oilseed and grain) increased 0.7% to $134.7 billion in August.
Inventories were up in three of the seven subsectors in August. The largest gains were recorded in the personal and household goods subsector (+5.6% to $22.5 billion), followed by the miscellaneous subsector (+0.8% to $15.8 billion).
The inventory-to-sales ratio rose from 1.55 in July to 1.58 in August. This ratio is a measure of the time (in months) required to exhaust inventories if sales were to remain at their current levels.
Table 1: Wholesale merchants' sales by industry—seasonally adjusted
Table 3: Wholesale merchants' inventories by industry—seasonally adjusted
Note to readers
Wholesale (sales and inventories) values exclude petroleum, petroleum products, and other hydrocarbons and oilseed and grain unless otherwise stated.
Petroleum, petroleum products, and other hydrocarbons and oilseed and grain data continue to be available in data tables but will be excluded from monthly analysis until historical data are available.
All data in this release are seasonally adjusted and expressed in current dollars unless otherwise noted.
Seasonally adjusted data are data that have been modified to eliminate the effect of seasonal and calendar influences to allow for more meaningful comparisons of economic conditions from period to period. For more information on seasonal adjustment, see Seasonally adjusted data – Frequently asked questions.
Trend-cycle estimates are included in selected charts as a complement to the seasonally adjusted series. These data represent a smoothed version of the seasonally adjusted time series and provide information on longer-term movements, including changes in direction underlying the series. For information on trend-cycle data, see Trend-cycle estimates – Frequently asked questions.
Both seasonally adjusted data and trend-cycle estimates are subject to revision as additional observations become available. These revisions could be large and could even lead to a reversal of movement, especially for reference months near the end of the series or during periods of economic disruptions.
Total wholesale sales expressed in volume are calculated by deflating current dollar values using relevant price indexes. The wholesale sales series in chained (2012) dollars is a chained Fisher volume index, with 2012 as the reference year. For more information, see the publication "Deflation of wholesale sales."
The Monthly Wholesale Trade Survey covers all industries within the wholesale trade sector, as defined by the North American Industry Classification System (NAICS), with the exception of business-to-business electronic markets, and agents and brokers (NAICS 419).
Real-time data tables
Real-time data tables 20-10-0020-01 and 20-10-0005-01 will be updated soon.
Next release
Wholesale trade data for September will be released on November 14.
Contact information
For more information, or to enquire about the concepts, methods or data quality of this release, contact us (toll-free 1-800-263-1136; 514-283-8300; infostats@statcan.gc.ca) or Media Relations (statcan.mediahotline-ligneinfomedias.statcan@statcan.gc.ca).