
Highlights
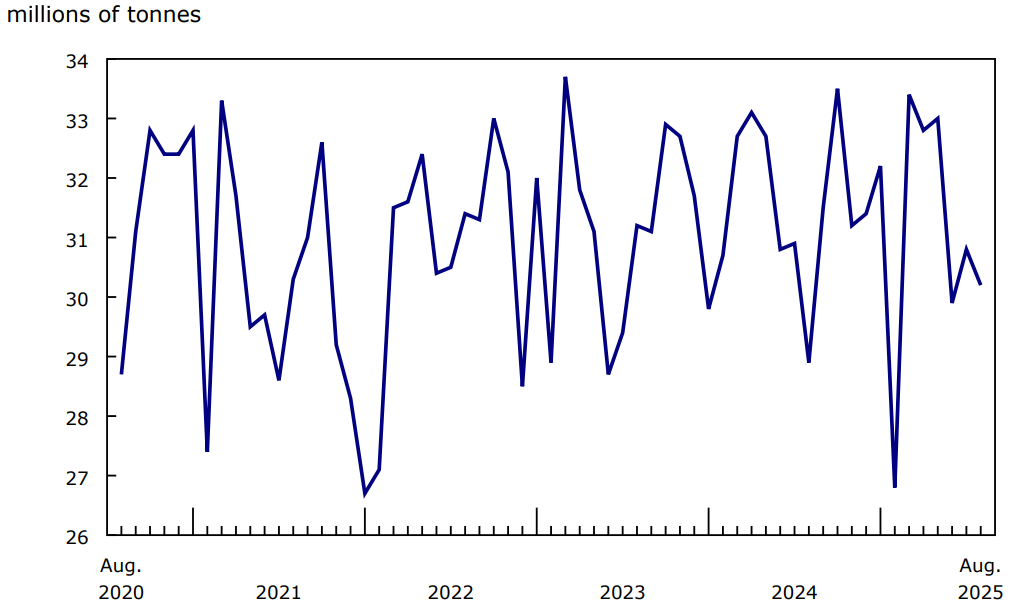
The total volume of rail freight carried in Canada reached 30.2 million tonnes in August 2025, up 4.5% from the same month one year earlier.
With this increase, the overall freight volume in August was slightly above the five-year historical average of 30.1 million tonnes for the month of August.
Chart 1: Railway carloadings, total tonnage
Description - Chart 1 Railway carloadings, total tonnage
Data table: Railway carloadings, total tonnage
Source: Table 23-10-0216-01.
The increase in total freight carried in August was driven by higher volumes of domestic loadings, both non-intermodal loadings (mainly commodities) and intermodal loadings (mainly containers).
Non-intermodal loadings up
Non-intermodal freight loadings (mainly commodities) in Canada were up for the second consecutive month, rising 4.3% year over year to 23.7 million tonnes in August, led by large increases in three commodities.
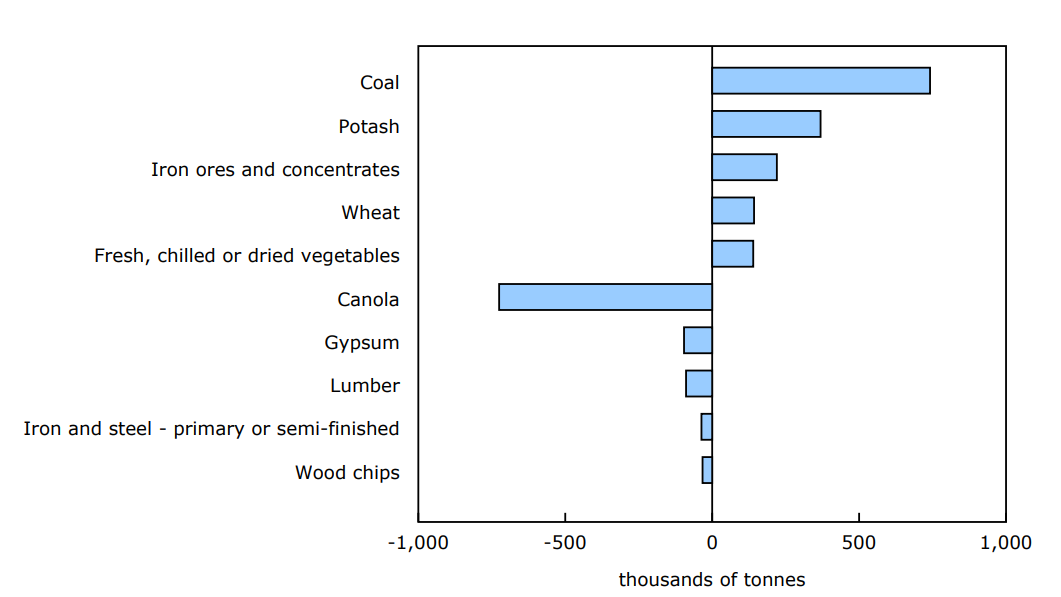
Year over year, coal recorded the largest increase in August, with loadings rising 28.2% (+741 000 tonnes) from August 2024. This was followed by loadings of potash, up 19.0% (+369 000 tonnes) in August 2025 compared with August 2024, and loadings of iron ores and concentrates, which increased by 4.5% (+220 000 tonnes) over the same period.
In comparison, loadings of canola (-71.0%; -725 000 tonnes), gypsum (-66.1%; -96 000 tonnes) and lumber (-14.3%; -89 000 tonnes) showed notable decreases in August 2025 compared with the same month the previous year.
Spotlight on canola
The volume of canola moved by rail totalled 297 000 tonnes in August 2025, the lowest monthly amount in three years. Rail is a key part of the supply chain delivering this product to market. In August, canola represented 1.3% of total non-intermodal rail traffic, down from 4.5% in the same month the previous year. To date in 2025 (January to August), carloadings of canola lag the same period in 2024 by more than half a million tonnes.
In August 2025, Canadian exports of canola fell year over year from $660 million to $354 million (-46.5%). This sharp decline was entirely due to exports to China, Canada's biggest market; its share of canola exports fell from 75.5% ($499 million) in August 2024 to 25.0% ($88 million) in August 2025. As part of escalating trade tensions, China has imposed a steep tariff on Canadian canola, significantly impacting exports. Most exports are shipped by rail from elevators from the Prairie provinces to ports on the Pacific Coast.
In 2025, Canada's crop yield for canola is projected to be higher compared with the previous year, as weather conditions provided ideal growing conditions in the Prairies. However, with as much as 90% of total crop production being destined for export in any given year, tariff-induced uncertainty remains.
Chart 2: Railway carloadings, largest commodity differences, August 2024 to August 2025
Description - Chart 2 Railway carloadings, largest commodity differences, August 2024 to August 2025
Data table: Railway carloadings, largest commodity differences, August 2024 to August 2025
Source: Table 23-10-0216-02.
Intermodal traffic up
Intermodal shipments—mainly containers—increased year over year for the sixth month in a row, up 22.5% to 3.1 million tonnes in August.
American freight traffic continues decline
In August, freight traffic received from the United States fell 7.1% to 3.4 million tonnes. According to Canadian international merchandise trade data, Canada's rail imports from (-13.9%) and exports to (-8.1%) the United States were down year over year in August.
Focus on Canada and the United States
Freight traffic received from US connections fell 7.1% (-259 000 tonnes) year over year to 3.4 million tonnes in August, marking the seventh straight month of decline in tonnage. However, this is the smallest year-over-year decline since February.
In 2023 and 2024, traffic received from US connections represented an average 12.0% of total rail tonnage each month. During the first quarter of 2025, this proportion edged down to 10.7% and then to 10.5% in the second quarter. More recently, however, this has increased to 10.9% in July and again to 11.3% in August.
Statistics Canada continues to monitor potential impacts of tariffs on railway carloading statistics.
For more data and insights on areas touched by the socio-economic relationship between Canada and the United States, see the Focus on Canada and the United States webpage.
Note to readers
The Monthly Railway Carloadings Survey collects data on the number of rail cars, tonnage, units and 20-feet equivalent units from railway transporters operating in Canada that provide for-hire freight services.
Cargo loadings from Armstrong, Ontario, to the Atlantic Coast are classified to the eastern division (Eastern Canada), while loadings from Thunder Bay, Ontario, to the Pacific Coast are classified to the western division (Western Canada).
Survey data are revised on a monthly basis to reflect new information.
The data in this release are not seasonally adjusted.
The Transportation Data and Information Hub, featuring data from Statistics Canada, Transport Canada and partners, provides Canadians with online access to comprehensive statistics and indicators for the country's transportation sector.
Contact information
For more information, or to enquire about the concepts, methods or data quality of this release, contact us (toll-free 1-800-263-1136; 514-283-8300; infostats@statcan.gc.ca) or Media Relations (statcan.mediahotline-ligneinfomedias.statcan@statcan.gc.ca).