
Highlights
Major Canadian airlines flew 8.1 million passengers on scheduled and charter services in August, down 3.8% from August 2024.
At the same time, aircraft movements at Canada's major and select small airports totalled 574,355 in August 2025, up 4.8% from the same month the previous year. Itinerant movements increased 3.7% year over year, while local movements rose 7.7%.
Airline operating statistics, and to a lesser extent aircraft movements, were affected by Air Canada and Air Canada Rouge flight cancellations and delays in mid-August caused by labour disruptions.
Air travel declines in August
Canadian Level I air carriers flew 8.1 million passengers on scheduled and charter services in August, 3.8% fewer than in August 2024.
The number of passenger-kilometres decreased 4.9% year over year to 22.7 billion in August 2025, while capacity declined 4.3% to 25.7 billion available seat-kilometres. The passenger load factor (the ratio of passenger-kilometres to available seat-kilometres) was 88.3% in August, slightly below the 88.9% observed in August 2024.
Chart 1: Passenger load factor, Canadian air carriers, Level I
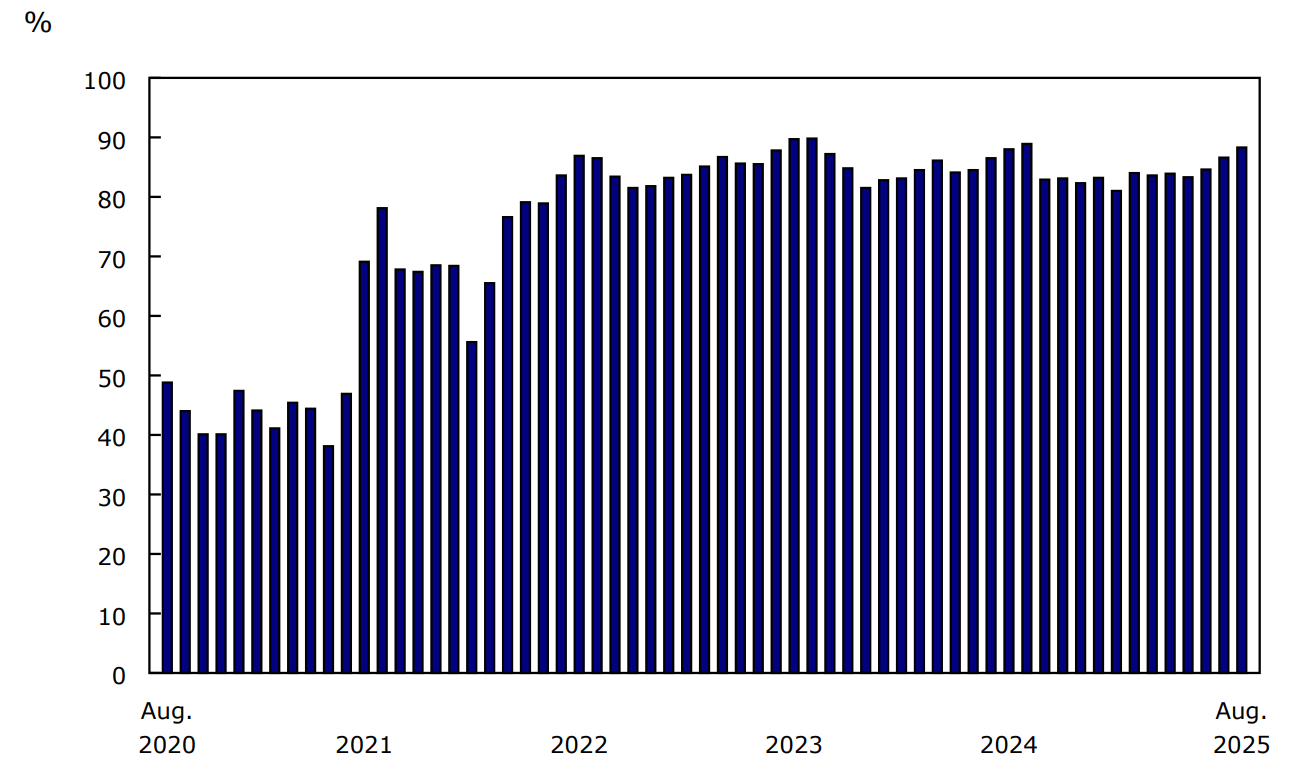
Description - Chart 1
Data table: Passenger load factor, Canadian air carriers, Level I
Source: Table 23-10-0079-01.
Each passenger travelled an average of 2,786 kilometres in August 2025, down 1.2% from the same month a year earlier.
Level I carriers flew 200,000 hours (-2.0%) in August and generated $2.8 billion (-4.7%) in total operating revenue.
Over the summer travel season of June to August, Level I air carriers flew 24.0 million passengers, a 1.2% decline from the same period in 2024. The decrease was driven by the 3.8% decline in August 2025.
Increase in local and domestic itinerant movements
In August, increased flight school activity at Canada's major and select small airports contributed to growth in local movements, which rose 7.7% year over year to 165,432. Increases were recorded in 10 provinces and territories, with the largest gains in Ontario (+5,590 movements), Alberta (+2,646), and British Columbia (+2,487).
Chart 2: Total aircraft movements at major and select small airports, by class of operation
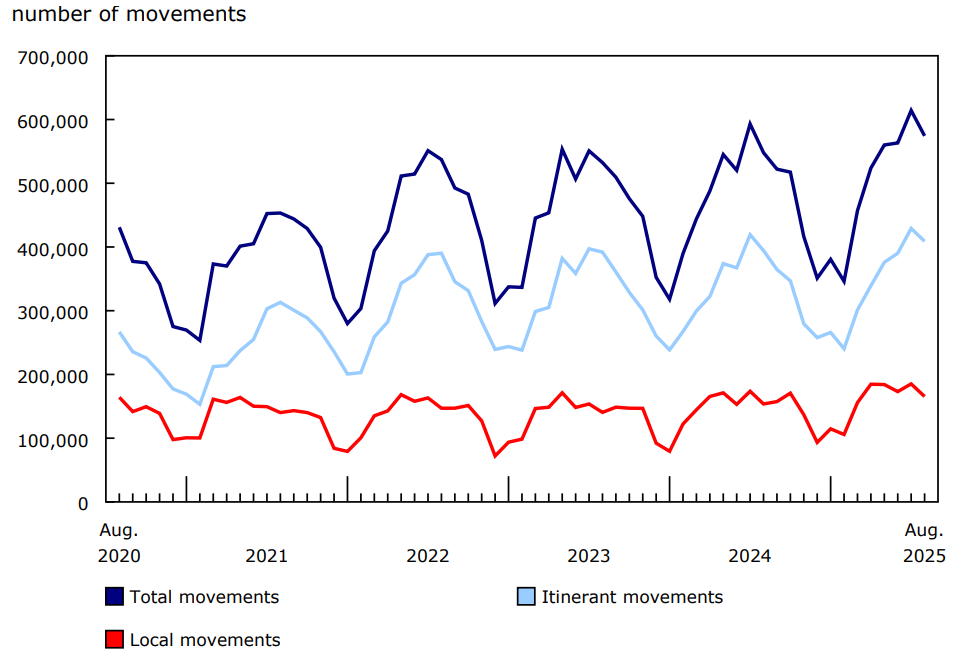
Description - Chart 2
Data table: Total aircraft movements at major and select small airports, by class of operation
Source: Table 23-10-0296-01.
At the same time, domestic itinerant movements grew 4.4% from the same month the previous year to reach 352,225 in August, also driven by other commercial operations, including flight school activity.
Transborder movements (to and from the United States) declined 2.2% to 39,443 in August, the fifth consecutive monthly year-over-year decrease. Meanwhile, other international movements (outside the United States) were up 3.1% year over year to 17,255.
Aircraft support for wildfires in Canada
In August 2025, wildfires continued to burn throughout Canada, contributing to unseasonably higher movements in the affected regions, since aircraft were used for wildfire response. Notably, Gander International Airport in Newfoundland and Labrador recorded 3,690 total movements, a year-over-year increase of 47.6%. Other airports with activities connected to wildfire suppression also recorded significant increases in aircraft movements—Stony Rapids, Saskatchewan (802 total movements; +40.5%); Flin Flon, Manitoba (803 movements; +32.1%); and Thompson, Manitoba (4,565 movements; +30.1%).
Aircraft movements during summer 2025
The summer months—June, July and August—have traditionally been the busiest time of year for the air transportation industry. In summer 2025, total aircraft movements increased 5.5% from the previous summer. However, aircraft traffic during summer 2025 remained below the pre-COVID-19 pandemic level in summer 2019.
Focus on Canada and the United States
Transborder aircraft movements (to and from the United States) represented 9.6% of total itinerant movements at Canada's major and select small airports in August 2025, down from 10.2% in August 2024. The decrease coincided with Air Canada flight cancellations and delays caused by labour disruptions.
In August 2025, year-over-year declines in movements to and from the United States were recorded at three of the four largest Canadian airports: Toronto/Lester B. Pearson International (-4.7%), Vancouver International (-0.3%) and Montréal/Pierre Elliot Trudeau International (-3.6%). In contrast, transborder movements at Calgary International increased 3.3%.
Meanwhile, the number of passengers carried by Canadian Level I air carriers on scheduled transborder flights in August 2025 was 18.1% below the level recorded in the same month of the previous year. This was the seventh consecutive month of year-over-year declines, and the largest of the seven declines. Capacity of these flights, measured in available seat-kilometres, declined year over year for the fifth consecutive month, down 15.5% from August 2024. The decreases coincided with Air Canada flight cancellations and delays caused by labour disruptions. The passenger load factor on scheduled transborder flights decreased from 87.7% in August 2024 to 82.2% in August 2025.
For more data and insights on areas touched by the socioeconomic relationship between Canada and the United States, see the Focus on Canada and the United States web page.
Note to readers
This consolidated monthly release covers the following statistical programs:
- Aircraft movement statistics (survey number 2715, tables 23-10-0296-01 to 23-10-0304-01)
- Monthly civil aviation statistics (survey number 5026, table 23-10-0079-01).
Consult the Aviation Data Visualization Hub to explore data from Aircraft movement statistics and Monthly civil aviation statistics in an interactive format.
The aviation statistics program uses respondent (Monthly civil aviation statistics) and administrative (Aircraft movement statistics) data.
An aircraft movement is defined as a take-off, landing or simulated approach by an aircraft, as defined by NAV CANADA.
An itinerant movement is the initial take-off or the final landing of an aircraft.
A domestic itinerant movement is defined as a movement, at a Canadian airport, of an aircraft departing to or arriving from a point in Canada.
A local movement is an aircraft conducting the following airport activities: touch-and-go, stop-and-go, simulated approach without landing, low approach, pull up while on final approach or missed approach. Local movements are often carried out during training flights (touch-and-go), equipment tests, etc.
On June 2, 2025, Stephenville Airport in Newfoundland and Labrador was closed. Since June 2025, movements for Stephenville Airport are excluded from Aircraft movement statistics. Data prior to June 2025 will continue to be available.
The Monthly Civil Aviation Survey covers all Canadian Level I air carriers: Air Canada (including Air Canada Rouge), Air Transat, Flair, Jazz, Porter and WestJet (including WestJet Encore). As of June 2025, Sunwing Airlines was fully integrated into WestJet.
The average passenger trip length is calculated by dividing the number of passenger-kilometres by the number of passengers. Trips across Canada and around the world are included in this calculation.
The data in this monthly release are not seasonally adjusted.
Data are subject to revisions.
Contact information
For more information, or to enquire about the concepts, methods or data quality of this release, contact us (toll-free 1-800-263-1136; 514-283-8300; infostats@statcan.gc.ca) or Media Relations (statcan.mediahotline-ligneinfomedias.statcan@statcan.gc.ca).