
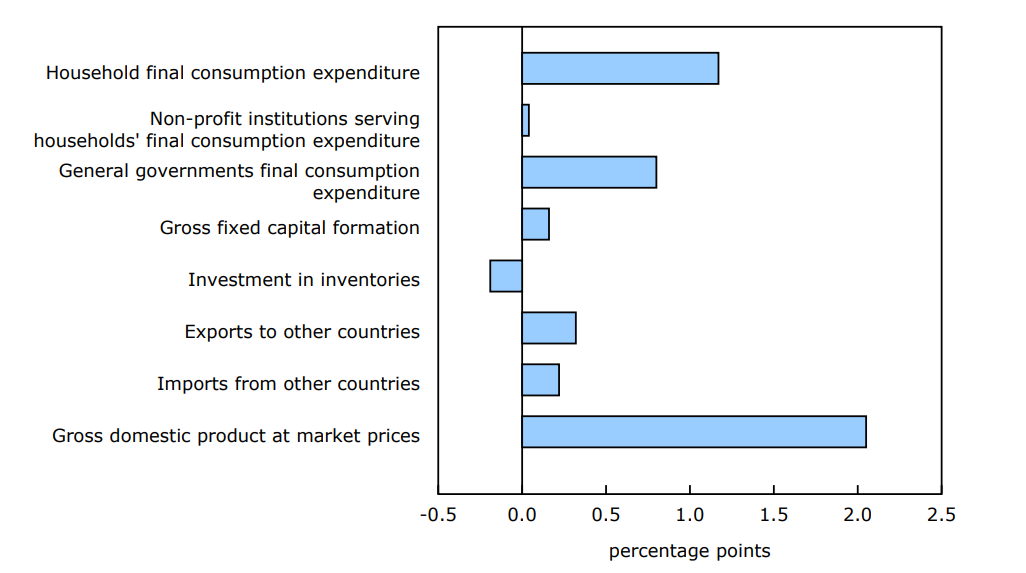
Canada's gross domestic product (GDP) increased 2.0% in 2024, the same rate of increase as in 2023, and following a 4.7% rise in 2022. The increase in 2024 was mainly driven by higher household final consumption expenditure, followed by a rise in government final consumption expenditure and exports. However, slower inventory accumulation and a decline in business investment moderated the overall increase in GDP in 2024.
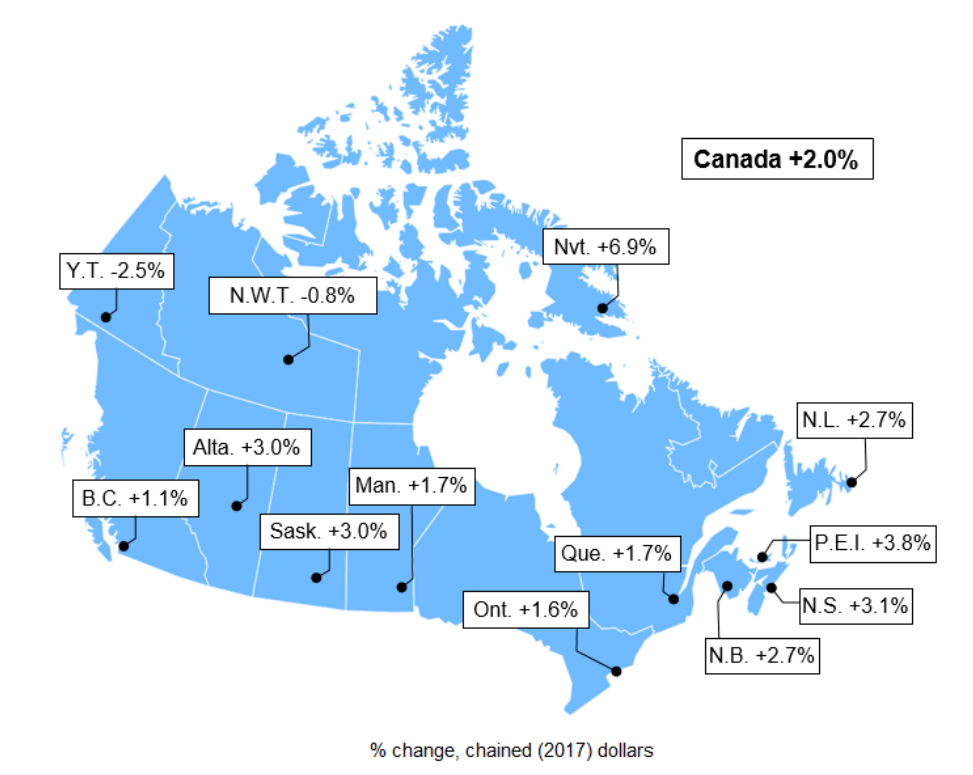
Map 1: Gross domestic product in 2024
Description - Map 1
The title of the map is "Gross domestic product in 2024"
This is a map of Canada by province and territory showing the year-over-year percentage changes, in chained (2017) dollars, in gross domestic product in 2024.
This map of Canada shows real gross domestic product in 2024. Canada up 2.0%, Newfoundland and Labrador up 2.7%, Prince Edward Island up 3.8%, Nova Scotia up 3.1%, New Brunswick up 2.7%, Quebec up 1.7%, Ontario up 1.6%, Manitoba up 1.7%, Saskatchewan up 3.0%, Alberta up 3.0%, British Columbia up 1.1%, Yukon down 2.5%, Northwest Territories down 0.8%, Nunavut up 6.9%.
Source: Table 36-10-0222-01.
In 2024, GDP rose in all provinces and in Nunavut, while Yukon and the Northwest Territories posted declines. Nunavut (+6.9%) posted the largest percentage increase in GDP, followed by Prince Edward Island (+3.8%), Nova Scotia (+3.1%), Saskatchewan (+3.0%) and Alberta (+3.0%). The three largest provinces—Quebec (+1.7%), Ontario (+1.6%) and British Columbia (+1.1%)—all grew at slower paces than the overall Canadian economy.
Chart 1: Contributions to percent change in real gross domestic product, expenditure-based, 2024
Description - Chart 1
Data table: Contributions to percent change in real gross domestic product, expenditure-based, 2024
Source: Table 36-10-0222-01.
Increased household spending buoys economic growth
In 2024, household spending rose 2.2%, the same rate of growth as in 2023 and following a 6.8% increase in 2022. The growth in 2024 was led by increased spending on new trucks, vans and sport utility vehicles, rent, financial services and telecommunication services.
Nunavut (+5.1%) posted the largest increase in household spending, followed by Manitoba (+3.4%), while Prince Edward Island (+0.1%) recorded the smallest rise.
The deflator of household consumption expenditure slowed in 2024 (+2.7%) from 2023 (+3.7%) and 2022 (+6.0%) as inflation eased across the country.
Prices for household consumption grew the most in Alberta and New Brunswick while Manitoba recorded the smallest rise in 2024.
Higher wages underpin growth in government final consumption expenditure
Government final consumption expenditure increased 3.8% in 2024, fuelled by a rise in real compensation of employees. The largest increases in government final consumption expenditure were in British Columbia (+5.1%), Alberta (+4.7%), Ontario (+4.2%) and Saskatchewan (+4.1%), while the Northwest Territories (-2.4%) recorded the lone decline.
International exports rise at a much slower pace than in previous year
International exports rose 0.9% in 2024, a substantial slowdown from the 6.2% growth in 2023. Exports of travel services (i.e., non-residents travelling in Canada) led the growth in 2024, while lower exports of motor vehicles and parts was the primary source of the deceleration in international exports.
Growth in international imports also slowed, up 0.7% in 2024 following a 1.2% rise in 2023. Although imports of travel services (i.e., Canadians travelling abroad) increased 8.9% in 2024, it was a substantial slowdown from the 31.8% increase in the previous year.
On a sub-national level in 2024, exports rose the most in New Brunswick (+6.2%) and Newfoundland and Labrador (+5.0%), with New Brunswick led by international exports and Newfoundland and Labrador led by increased exports to other provinces and territories.
Imports rose the most in Nunavut (+8.1%) in 2024, largely due to increased imports from other provinces and territories, followed by New Brunswick (+4.2%) where the increase was also due to imports from other provinces and territories—as well as to imports from other countries. Among the provinces, total imports declined in both Ontario (-0.3%) and British Columbia (-1.1%).
Internal trade accounts for roughly one-third of all trade flows in 2024
Internal trade (exports and imports between provinces and territories) amounted to $527.2 billion in 2024 on a nominal basis, accounting for roughly one-third of all trade in Canada. Yukon (69.2%) and Manitoba (52.4%) sold more of their goods and services within Canada as a share of their total exports, while Newfoundland and Labrador (25.3%) had the smallest internal export share across the country.
On the import side, the three territories and Prince Edward Island had the largest internal import shares, as they purchased nearly two-thirds of their imported goods and services from other provinces or territories rather than from other countries. On the other hand, Ontario had the smallest internal import share in 2024, as the province purchased its imported goods and services primarily from other countries.
With this release, a new data table, "Provincial and Territorial Trade Flows," and data visualization product, "Provincial and territorial trade flows by detailed product classification," have been published for the first time.
Businesses continue to accumulate inventory at a slower pace compared with record high in 2022
The accumulation of business non-farm inventories was slower in 2024 ($6.8 billion) and 2023 ($12.8 billion) compared with the record high in 2022 ($35.1 billion). The slowdown in inventory accumulations were widespread but driven by the manufacturing and distributive trade sectors. Ontario and Quebec recorded the largest slowdowns in business inventory accumulations in 2024 relative to 2022, whereas Newfoundland and Labrador and Prince Edward Island accumulated business inventory at a slightly faster pace in 2024 than in 2022.
Business investment falls due to lower spending on non-residential structures and machinery and equipment
Business investment in non-residential structures fell 1.7% in 2024, the first annual decline since 2020. The contraction in investment in non-residential structures was led by a 19.0% decline in British Columbia, where four energy mega-projects were either fully or substantially completed in 2024. The Northwest Territories (-22.3%) and Yukon (-16.7%) also posted notable declines in investment in non-residential structures, while Nunavut (+26.7%) posted the largest increase across the country, coinciding with a major gold mine project.
In 2024, businesses invested 1.0% less in machinery and equipment, with declines recorded in five provinces and two territories. The Northwest Territories (+7.0%) posted the largest increase in business investment in machinery and equipment, led by the construction sector.
Housing investment edges down in 2024, but at slower pace than in previous two years
Housing investment edged down 0.2% in 2024, following declines of over 9% in both 2023 and 2022. While renovations to existing homes was the driver of the downturn in 2024, increases in new construction and ownership transfer costs helped moderate the impact. The national decline in 2024 was due to decreased investment in Ontario (-4.8%) and British Columbia (-6.8%). The Northwest Territories (-11.7%) was the only other jurisdiction where housing investment contracted in 2024. Meanwhile, investment in housing rose the most in Prince Edward Island (+18.2%), Alberta (+13.6%) and Yukon (+11.1%), as these regions also experienced the largest increases in their population relative to the rest of the country.
Nominal gross domestic product growth slows from inflation high of 2022
Nominal GDP rose 4.8% in 2024, following a 3.5% rise in 2023 and a 12.9% rise in 2022. The slower growth in 2024 compared with 2022 was largely due to subdued growth in nominal household final consumption expenditure which coincided with easing inflationary pressure. Slower accumulations of business inventories, which were well off the high from 2022, were also a factor in the deceleration of nominal GDP growth over the two-year span.
Compensation of employees continues to rise
Compensation of employees rose in every province and territory in 2024, the fourth consecutive year of increases since the COVID-19 pandemic-induced decline in 2020.
Nationally, compensation of employees rose 5.9% in 2024, led by increases in professional and personal services, health care and social assistance and educational services. Growth was highest in Nunavut (+12.2%), Prince Edward Island (+7.7%), the Northwest Territories (+7.6%) and Nova Scotia (+7.2%). Meanwhile, growth in compensation of employees was lowest in Alberta (+4.9%).
Corporate incomes rebound
Incomes of corporations, as measured by their gross operating surplus, rose 0.6% in 2024, after declining 5.2% in 2023. The increase in 2024 was led by gains in Quebec (+4.1%) and Alberta (+2.7%). The strength in Quebec was primarily due to gains in manufacturing and construction, while Alberta recorded increases in sectors impacted by population growth, such as retail trade and wholesale trade as well as construction. Ontario (+1.5%) posted moderate growth in the gross operating surplus of corporations as strength in the services sector continued to offset flat income within the manufacturing sector. In 2024, British Columbia (-7.3%) and Saskatchewan (-6.1%) recorded notable declines in the gross operating surplus of corporations as these regions were affected by weaker natural resource prices.
Household saving increases as interest rates decline and spending pressures ease
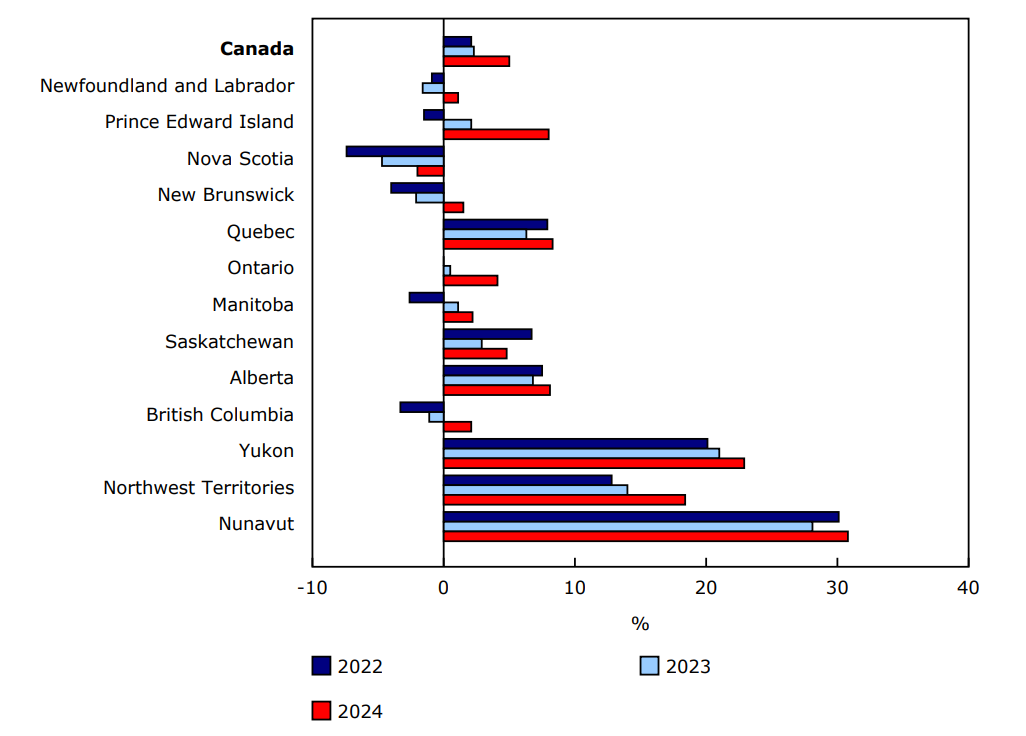
Nationally, the household saving rate reached 5.0% in 2024, more than double the rate recorded a year earlier (2.3%). Income, fuelled by growth in employee compensation and unincorporated non-farm business incomes, grew at a faster pace than nominal consumption expenditure as inflationary pressures eased.
Among the provinces, saving rates were highest in Quebec (8.3%), Alberta (8.1%) and Prince Edward Island (8.0%). Ontario (4.1%) had a below-average saving rate in 2024, but it recorded the strongest increase in net saving relative to a year earlier. The territories continued to record the highest household saving rates, across the country. On aggregate, households in Nova Scotia continued to be negative net savers in 2024, meaning their nominal consumption expenditure surpassed their disposable income.
Interest payments on both mortgages and non-mortgage loans were up 9.6% in 2024, but this represented a significant slowdown from 2023 (+42.7%). The Bank of Canada began to lower its policy rate starting in June 2024, which helped ease borrowing costs for some households. However, since 2021, interest payments for households have nearly doubled, with all provinces and territories recording increases. Overall investment income, termed property income received, rose 12.6% in 2024, outpacing interest payments for the first time since 2021.
Households in Ontario (10.9%) and British Columbia (10.3%) had the highest debt service ratios in the country as they held more average debt, especially for housing. In 2024, both of these provinces also recorded the largest increases in their debt service ratios since 2022.
Chart 3: Household saving rate, 2022, 2023 and 2024
Description - Chart 2
Data table: Household saving rate, 2022, 2023 and 2024
Source: Table 36-10-0224-01.
Note to readers
Provincial and territorial gross domestic product by income and expenditure accounts
This release incorporates updates to the Provincial and Territorial Economic Accounts (PTEA) for 2022 and 2023, as well as new data for 2024. This release incorporated the 2022 benchmark provincial and territorial supply and use tables, and includes various updated source data including but not limited to: T4 wages and salaries benchmark data for 2023 and preliminary estimates for 2024; revised data from the Retail Commodity Survey, the International Trade in Services Survey, and the 2023 actual estimates and 2024 major project updates from the Annual Capital and Repair Expenditures Survey.
At certain times of the year, Canada totals in the PTEA do not correspond to the national gross domestic product (GDP) by income and by expenditure accounts estimates. The two accounts are brought back in line when annual revisions are incorporated with the third quarter release (November 28, 2025).
Unless otherwise stated, all percentage changes for expenditure-based statistics (such as household spending, exports and imports) are calculated and reported in this release from volume measures adjusted for price variations using a chained Fisher index formula.
For more information on GDP, see the video "What is Gross Domestic Product (GDP)?"
For more information on revisions to GDP, see the article "Revisions to Canada's GDP."
The PTEA for 2025 will be released on November 5, 2026.
Gross domestic product by industry – Provincial and territorial (annual)
This release includes revised estimates of provincial and territorial GDP by industry for the period 1997 to 2024 due to the incorporation of a new industry classification.
The new industry classification incorporates the North American Industry Classification System (NAICS) Canada 2022 Version 1.0. It also includes a reorganization of the financial industries to better align with the institutional sector classification, aggregations of some industries in the manufacturing and construction sectors, and the introduction of greater detail in some industries where it was deemed analytically or statistically useful.
A detailed view of these changes and relevant concordance files are available upon request.
In addition to the change in industry classification, the provincial and territorial GDP by industry estimates were revised due to the implementation of the double deflation approach for the derivation of constant price measures, which affects the entire time series from 1997 until reference year 2022.
These revisions are part of Statistics Canada's commitment to providing accurate, high-quality data and reflect statistical best practices. The impact of these revisions on previously published GDP headline figures and overall trends is minimal, as the total economy estimates remain aligned with the published GDP by income and expenditure estimates.
Contact information
For more information, or to enquire about the concepts, methods or data quality of this release, contact us (toll-free 1-800-263-1136; 514-283-8300; infostats@statcan.gc.ca) or Media Relations (statcan.mediahotline-ligneinfomedias.statcan@statcan.gc.ca).