

Wholesale sales (excluding petroleum, petroleum products, and other hydrocarbons and oilseed and grain) rose 0.6% in September as gains in five subsectors outpaced declines in two others. This was the sixth increase in wholesale sales in nine months. Sales in September were 4.0% higher compared with the same month one year earlier.
Despite ongoing trade uncertainty, sales in the third quarter of 2025 were the highest on record for the wholesale sector, 0.2% higher than the previous record set in the first quarter of 2025.
In volume terms, wholesale sales (excluding petroleum, petroleum products, and other hydrocarbons and excluding oilseed and grain) rose 0.6% in September.
Chart 1: Wholesale sales (excluding petroleum, petroleum products, and other hydrocarbons and oilseed and grain) increase in September
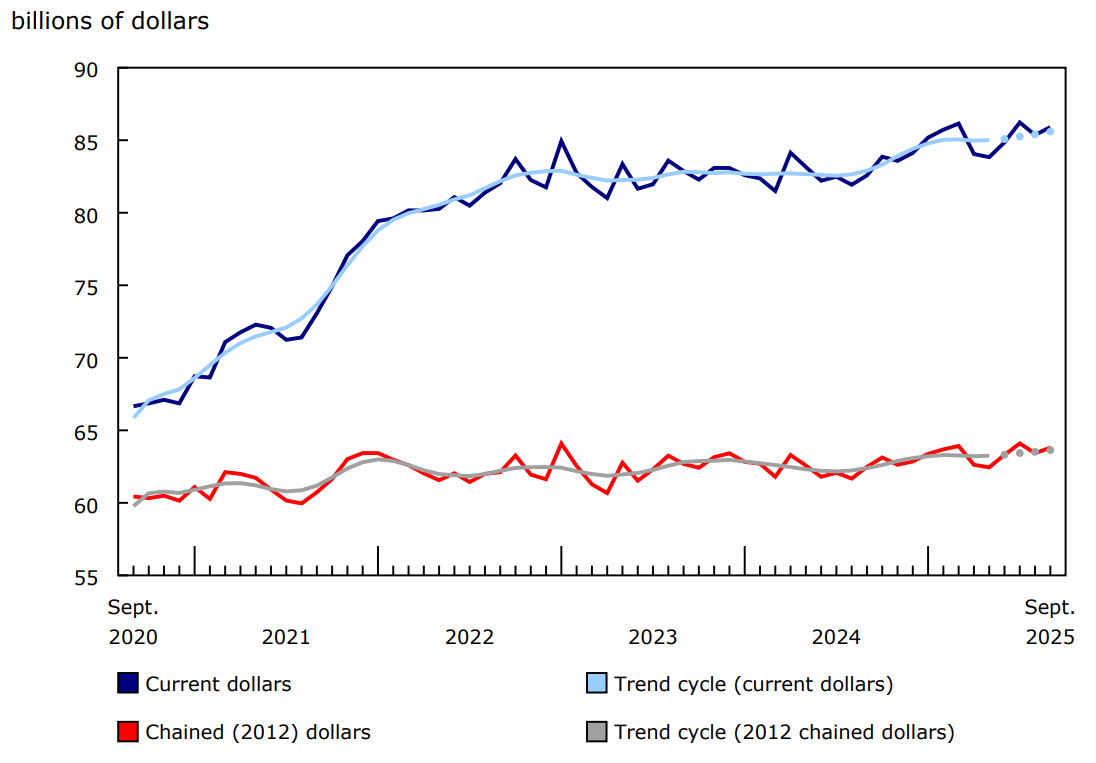
Description - Chart 1
Notes: The higher variability associated with the trend-cycle estimates is indicated on the chart with a dotted line for the current reference month and the previous three months. For more information, see the Note to readers.
Sources: Tables 20-10-0074-01 and 20-10-0003-01.
Food, beverage and tobacco lead sale increases in September
The increase in wholesale sector sales for September was led by a 1.6% (+$250 million) gain in the food, beverage and tobacco subsector. Food, beverage and tobacco sales have risen 8.2% since September 2024, approximately 40% of which was a result of price increases.
In September 2025, sales in the building material and supplies subsector rose to their highest level in seven months, up 1.9% (+$226 million) to $12.2 billion. Sales in September were 4.6% higher than in September 2024, and building material and supplies subsector sales in the third quarter were 2.3% higher than in the second quarter.
Motor vehicle and motor vehicle parts and accessories merchant wholesalers reported a 1.6% increase in sales to $14.3 billion in September. In September, sales were down compared with September 2024, but in the third quarter of 2025, sales for the subsector were 2.5% higher than in the third quarter of 2024.
Sales in the mineral, ore and precious metals industry group rose 22.8% to $1.2 billion in September 2025, the second consecutive monthly increase exceeding 20%. Gains in this industry group reflected strength in the prices of key commodities, particularly gold.
Sales increase in seven provinces
In September, seven provinces recorded higher wholesale sales, led by Alberta, Quebec and British Columbia.
In Alberta, wholesale sales rose 2.0% to $9.9 billion in September, led by increases in the machinery, equipment and supplies subsector and the food, beverage and tobacco subsector. Sales of machinery, equipment and supplies rose 2.7% (+$87.5 million) to $3.3 billion in September, the third consecutive monthly increase for this subsector. Sales of machinery, equipment and supplies in Alberta were at their highest level in seven months. Food, beverage and tobacco sales rose 4.4% in September, the third increase in four months.
Wholesalers in Quebec reported a 1.2% increase in sales in September, on the strength of sales in the food, beverage and tobacco subsector (+2.5%). Wholesale sales in Quebec rose for the third time in four months and were 4.7% higher than in September 2024.
In British Columbia, wholesale sales rose 2.2% in September 2025, reflecting growth in the building material and supplies subsector and the mineral, ore and precious metals industry group. Total wholesale sales in British Columbia were at their highest level since January 2025.
Inventories fall in September
Wholesale inventories (excluding petroleum, petroleum products, and other hydrocarbons and excluding oilseed and grain) decreased 0.2% to $135.1 billion in September.
Inventories were down in three of the seven subsectors in September. The largest declines were recorded in the building material and supplies subsector (-2.3% to $23.3 billion), followed by the miscellaneous subsector (-1.4% to $15.5 billion).
The inventory-to-sales ratio decreased from 1.59 in August to 1.57 in September. This ratio is a measure of the time (in months) required to exhaust inventories if sales were to remain at their current levels.
Table 1: Wholesale merchants' sales by industry—seasonally adjusted
Table 3: Wholesale merchants' inventories by industry—seasonally adjusted
Note to readers
Wholesale (sales and inventories) values exclude petroleum, petroleum products, and other hydrocarbons and oilseed and grain unless otherwise stated.
Petroleum, petroleum products, and other hydrocarbons and oilseed and grain data continue to be available in data tables but will be excluded from monthly analysis until historical data are available.
All data in this release are seasonally adjusted and expressed in current dollars unless otherwise noted.
Seasonally adjusted data are data that have been modified to eliminate the effect of seasonal and calendar influences to allow for more meaningful comparisons of economic conditions from period to period. For more information on seasonal adjustment, see Seasonally adjusted data – Frequently asked questions.
Trend-cycle estimates are included in selected charts as a complement to the seasonally adjusted series. These data represent a smoothed version of the seasonally adjusted time series and provide information on longer-term movements, including changes in direction underlying the series. For information on trend-cycle data, see Trend-cycle estimates – Frequently asked questions.
Both seasonally adjusted data and trend-cycle estimates are subject to revision as additional observations become available. These revisions could be large and could even lead to a reversal of movement, especially for reference months near the end of the series or during periods of economic disruptions.
Total wholesale sales expressed in volume are calculated by deflating current dollar values using relevant price indexes. The wholesale sales series in chained (2012) dollars is a chained Fisher volume index, with 2012 as the reference year. For more information, see the publication "Deflation of wholesale sales."
The Monthly Wholesale Trade Survey covers all industries within the wholesale trade sector, as defined by the North American Industry Classification System (NAICS), with the exception of business-to-business electronic markets, and agents and brokers (NAICS 419).
Annual Revisions
Along with data from September 2025, we are releasing revised data as part of our normal revisions processes. Unadjusted data from January 2024 to August 2025 have been revised as has seasonally adjusted data from January 2021 to August 2025.
Real-time data tables
Real-time data tables 20-10-0020-01 and 20-10-0005-01 will be updated soon.
Next release
December 12, 2025.
Contact information
For more information, or to enquire about the concepts, methods or data quality of this release, contact us (toll-free 1-800-263-1136; 514-283-8300; infostats@statcan.gc.ca) or Media Relations (statcan.mediahotline-ligneinfomedias.statcan@statcan.gc.ca).