
Many Canadian cities and towns were not as green in the summer of 2025 compared with one year earlier, mostly due to drought conditions across the country.
"Urban greenness" is a measure that assesses the condition and health of an urban landscape. Vegetation contributes to more livable, beautiful communities by helping to clean the air, moderate the local climate, control water flow and provide habitats for wildlife.
In the summer of 2025, just under three-quarters (74.5%) of the land area of 1,016 population centres across Canada was classed as green, a slight decrease from 75.6% in the summer of 2024.
All but the three most western provinces in Canada experienced a decrease in greenness in 2025. Despite this reduction, the Atlantic provinces were still the greenest across Canada, while the Prairie region was the least green.
Have your say on the products we release from the Census of Environment!
We are looking for feedback from the users of our products. If you would like to provide your perspective on the relevance, usability, accessibility and quality of our products and data releases, please visit the page "Census of Environment Feedback Form" to participate.
Chart 1: Urban greenness, all population centres, by province, summer of 2025
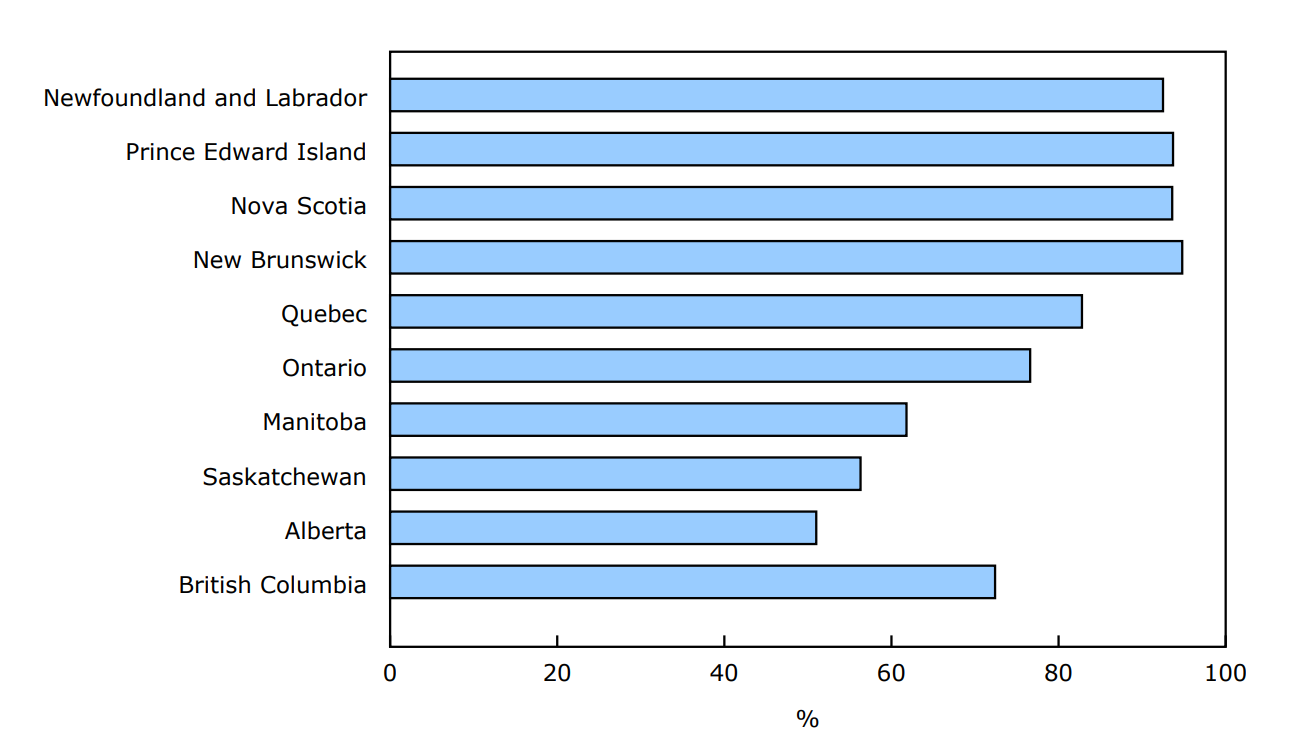
Description - Chart 1
Data table: Urban greenness, all population centres, by province, summer of 2025
Source: Table 38-10-0158-01.
Analysis of satellite imagery for summer 2025 revealed that the greenest large urban population centres were St. John's (93.5%), Newfoundland and Labrador, Saint-Jérôme (93.1%), Sherbrooke (92.3%) and Gatineau (92.2%), Quebec, and White Rock (91.0%), British Columbia.
Largest decreases in greenness occurred in Ontario and Manitoba in summer 2025 compared with summer 2024
More than two-thirds (68.5%) of the land area of Canada's large urban population centres was classed as green in the summer of 2025, down from 70.3% in the summer of 2024. The largest decreases occurred in Ontario (-4.6 percentage points to 76.6%) and Manitoba (-4.4 percentage points to 61.8%). In contrast, Alberta saw the largest increase in greenness, up 7.7 percentage points to 51.0%.
Urban greenness decreased in all the largest urban population centres of Atlantic Canada, Quebec, Ontario and Manitoba from one year earlier, with the exceptions of London (+0.8 percentage points to 85.9%), Ontario, Sherbrooke (+0.3 percentage points to 92.3%), Quebec, and Chicoutimi-Jonquière (unchanged, at 87.2%), Quebec.
For the Prairie provinces, four of the five biggest cities were more green in summer 2025 compared with one year earlier. Calgary (+16.0 percentage points to 44.4%) showed the largest increase, whereas Winnipeg's urban greenness score decreased 5.3 percentage points to 47.4%.
Year over year, urban greenness rose in four of the six largest cities in British Columbia, with Kelowna (+6.7 percentage points to 55.6%) having the largest increase.
Urban areas have become less green since 2000
The long-term trend from 2000 to 2025 reveals a decline in greenness within Canadian urban areas.
When compared with the baseline period (2000 to 2004), average urban greenness in Canada fell by 8.2 percentage points over the most recent five-year period (2021 to 2025).
Urban greenness declined in every province and every major urban area since 2000, with the largest drops being in Canada's large urban population centres (-10.5 percentage points from the 2000-to-2004 average to the current five-year period).
Table 1: Urban greenness, large urban population centres, top five largest centres
Table 2: Urban greenness, large urban population centres, five largest differences over time
Note to readers
Data for two urban greenness measures by population centre are now available from 2000 to 2025 in table 38-10-0158-01. These measures provide information on the condition of urban ecosystems as part of Statistics Canada's Census of Environment program.
Geospatial files and metadata now include data for 2025.
Both greenness measures were computed from the normalized difference vegetation index (NDVI). Weekly NDVI images from satellite imagery from the moderate resolution imaging spectroradiometer (MODIS) during peak summer conditions (Julian calendar weeks 26 to 34, approximately late-June to late-August) were averaged to provide a measure of vegetation condition for each year for the same physical area using the 2021 population centre boundary to ensure consistency. Population centres have a population of at least 1,000 and a population density of 400 people or more per square kilometre, based on population counts from the Census of Population. MODIS imagery was available for population centres south of the 60th parallel north only.
The average NDVI is the average of all pixel NDVI values. The urban "green" class corresponds to areas with an average NDVI greater than or equal to 0.5, representing areas that are predominantly vegetated. Areas with average NDVI values less than 0.5 are considered "grey" and are largely non-vegetated, though patches of grass, shrubs, crops or other unhealthy/poor condition vegetation will be included. Water pixels were excluded.
Long-term and temporary changes in greenness can be linked to urbanization processes, including urban expansion and densification, as well as to the addition or maturing of vegetation and to natural factors such as drought, fire, pests or disease.
Statistics Canada's Census of Environment program reports on ecosystems in Canada, providing information to help Canadians make evidence-based decisions to protect and enhance the environment. The program follows the internationally accepted environmental-economic standard for producing information on ecosystems' extent, their condition and the services they provide.
For more information, see "Canadian System of Environmental-Economic Accounting – Ecosystem Accounts (5331)."
Today's release also includes an update to the selected population characteristics table (38-10-0047-01). The table will now include the ecoprovince geography.
Contact information
For more information, or to enquire about the concepts, methods or data quality of this release, contact us (toll-free 1-800-263-1136; 514-283-8300; infostats@statcan.gc.ca) or Media Relations (statcan.mediahotline-ligneinfomedias.statcan@statcan.gc.ca).