
Highlights
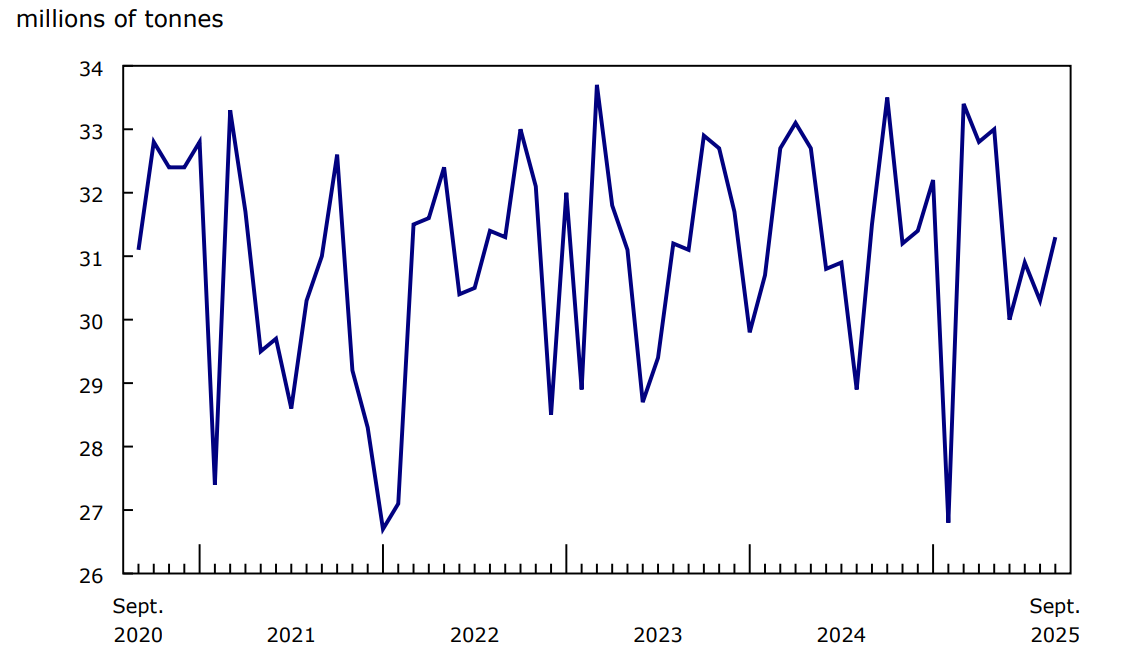
Canadian railways transported 31.3 million tonnes of freight in September, slightly below (-0.7%) September 2024 levels. Strong growth in carloadings of wheat and other cereal grains tempered a lower volume of freight traffic from US rail connections.
Freight traffic volume for the month was on par with the five-year average of 31.2 million tonnes for September. Year-to-date through September 2025, total cargo moved by rail amounted to 280.7 million tonnes, marginally below (-0.1%) the same January-to-September period in 2024.
Chart 1: Railway carloadings, total tonnage
September's total rail freight reflected a lower volume of freight traffic from US rail connections that was offset by both domestic non-intermodal loadings (mainly commodities) and intermodal loadings (mainly containers).
Loadings of wheat and other cereal grains remain strong
In September 2025, non-intermodal freight traffic in Canada was up 2.8% year over year to 25.4 million tonnes, driven by large increases in the loadings of wheat and other cereal grains.
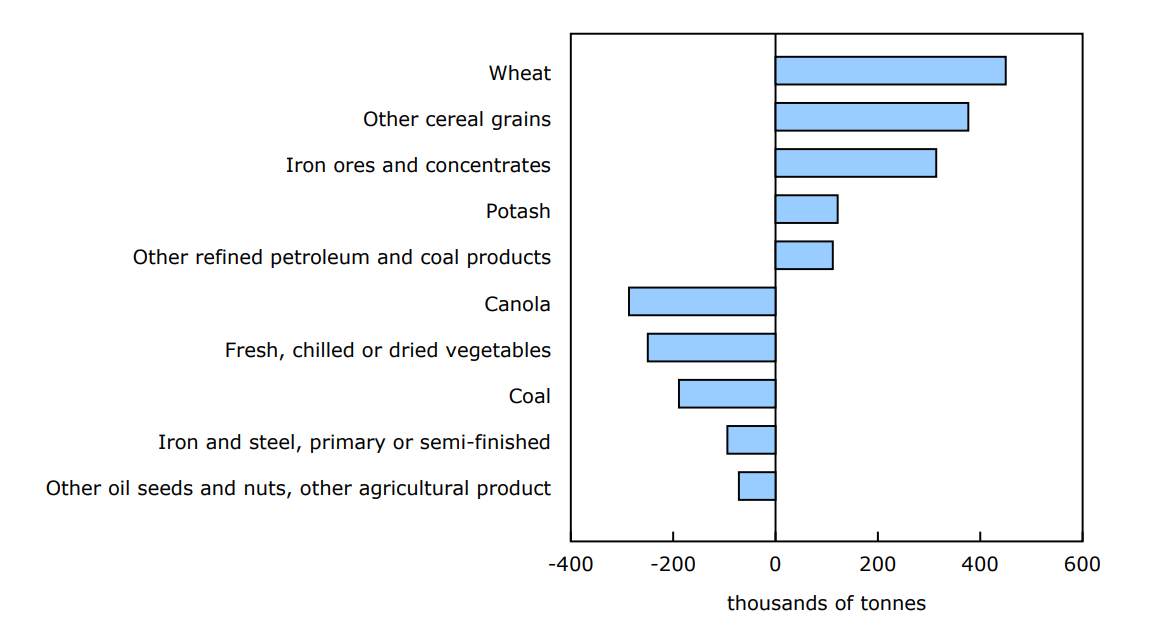
Carloadings of wheat have risen year over year for the seventh consecutive month, up 18.1% (+450 000 tonnes) from September 2024, following similar increases in July (+15.3%) and August (+11.2%) 2025. This upward trend should continue as Canadian wheat production is expected to grow on higher yields for the 2025 crop.
Meanwhile, loadings of other cereal grains grew 72.7% (+377 000 tonnes) in September over the same month in 2024, marking the third consecutive month of year-over-year growth.
Finally, loadings of iron ores and concentrates rose year over year, up 7.0% (+314 000 tonnes) compared with September 2024.
Chart 2: Railway carloadings, largest commodity differences, September 2024 to September 2025
Description - Chart 2
Data table: Railway carloadings, largest commodity differences, September 2024 to September 2025
Source: Table 23-10-0216-02.
Carloadings of canola and fresh, chilled or dried vegetables dampen volumes
Amid the tariff uncertainty noted in the August report, rail carloadings of canola fell year over year for the fourth month in a row, dropping by 35.4% (-286 000 tonnes) in September 2025, following a steep 70.4% drop in August.
Loadings of fresh, chilled or dried vegetables dropped 30.5% (-250 000 tonnes) below September 2024 levels—the largest drop in tonnage since February 2022.
Year over year, other decreases were reported in coal, with loadings down 6.0% (-189 000 tonnes) from September 2024.
Intermodal traffic continues upward trend
In September 2025, intermodal shipments originating from Canada—mainly containers—continued their upward trend, rising 5.0% year over year to 3.1 million tonnes. This was the seventh straight month of year-over-year increases.
Container volume reached its fifth-highest tonnage on record for the month of September—reflecting demand for consumer goods.
American freight continues to slump
Freight traffic arriving from the United States dropped sharply year over year in September 2025, and for the eighth month in a row. Tonnage fell 26.7% from the same month in 2024 to 2.9 million tonnes—the lowest volume recorded for the month of September in almost 10 years.
Focus on Canada and the United States
Over 2023 and 2024, freight loadings from US rail connections represented an average of 12.0% of total rail tonnage each month. During the first quarter of 2025, this proportion edged down to 10.7% and then to 10.5% in the second quarter. After hovering around 11% during July and August, it fell to 9.2% in September.
Statistics Canada continues to monitor potential impacts of tariffs on railway carloading statistics.
For more data and insights on areas touched by the socio-economic relationship between Canada and the United States, see the Focus on Canada and the United States webpage.
Note to readers
The Monthly Railway Carloadings Survey collects data on the number of rail cars, tonnage, units and 20-feet equivalent units from railway transporters operating in Canada that provide for-hire freight services.
Cargo loadings from Armstrong, Ontario, to the Atlantic Coast are classified to the eastern division (Eastern Canada), while loadings from Thunder Bay, Ontario, to the Pacific Coast are classified to the western division (Western Canada).
Survey data are revised on a monthly basis to reflect new information.
The data in this release are not seasonally adjusted.
The Transportation Data and Information Hub, featuring data from Statistics Canada, Transport Canada and partners, provides Canadians with online access to comprehensive statistics and indicators for the country's transportation sector.
Contact information
For more information, or to enquire about the concepts, methods or data quality of this release, contact us (toll-free 1-800-263-1136; 514-283-8300; infostats@statcan.gc.ca) or Media Relations (statcan.mediahotline-ligneinfomedias.statcan@statcan.gc.ca).