
Highlights
Major Canadian airlines flew 7.2 million passengers on scheduled and charter services in September, up 2.3% from September 2024.
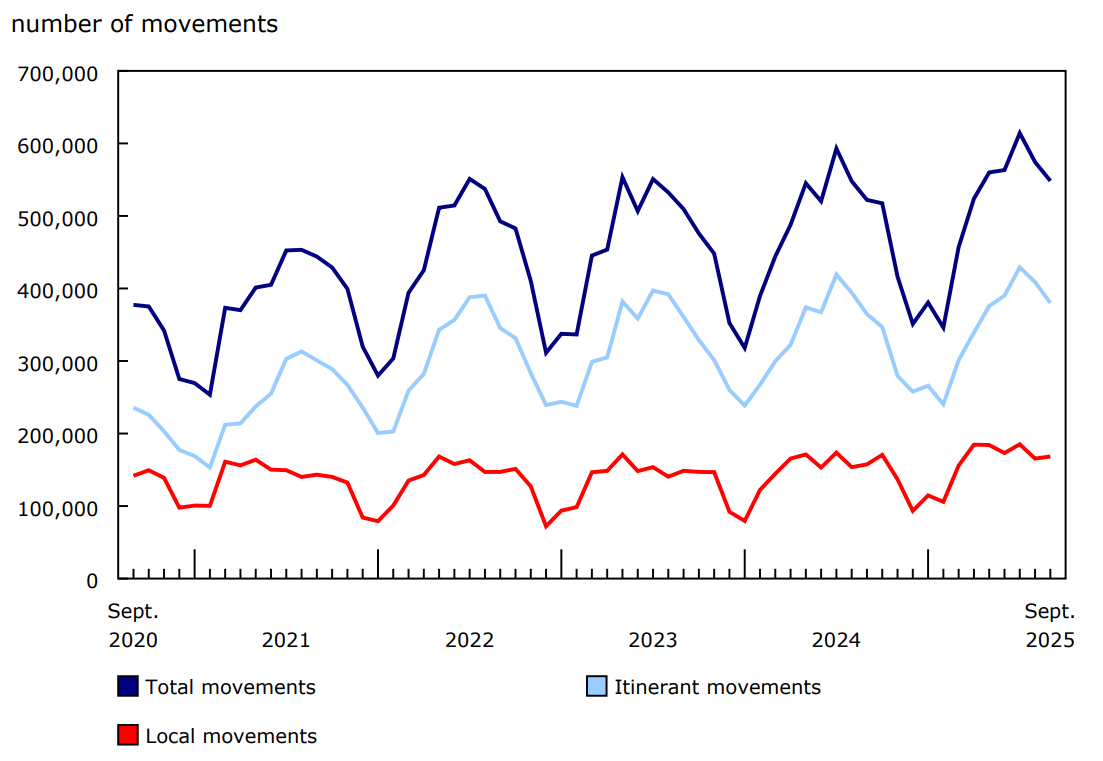
Aircraft movements at Canada's major and select small airports totalled 548,386 in September 2025, up 5.0% from the same month the previous year. Itinerant movements increased 4.2% year over year, while local movements rose 7.0%.
Consult the Aviation Data Visualization Hub to explore aircraft movement statistics and monthly civil aviation statistics in an interactive format.
Air travel resumes growth in September
Canadian Level I air carriers flew 7.2 million passengers on scheduled and charter services in September, 2.3% more than in September 2024. This was the first notable year-over-year increase since January 2025.
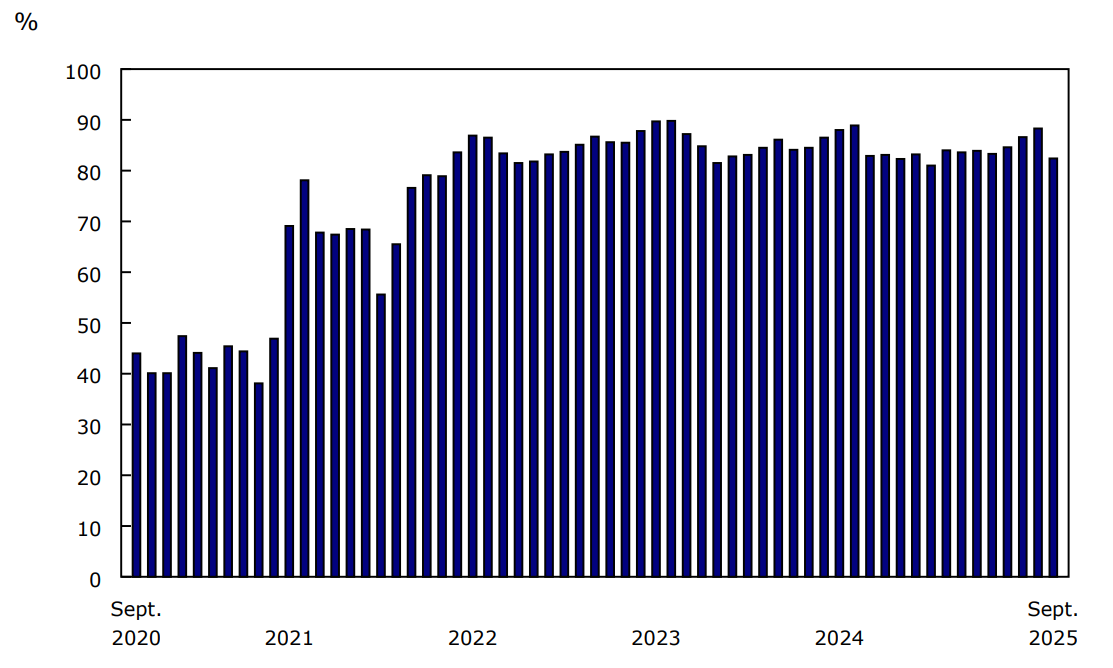
The number of passenger-kilometres rose 3.3% year over year to 20.6 billion in September, while capacity increased 3.9% to 25.0 billion available seat-kilometres. As a result, the passenger load factor (the ratio of passenger-kilometres to available seat-kilometres) was 82.4% in September, slightly below the 82.9% observed in September 2024.
Chart 1: Passenger load factor, Canadian air carriers, Level I
Description - Chart 1
Data table: Passenger load factor, Canadian air carriers, Level I
Source: Table 23-10-0079-01.
Each passenger travelled an average of 2,858 kilometres in September 2025, up 1.0% from the same month a year earlier.
Level I carriers flew 190,000 hours (+3.8%) in September and generated $2.7 billion (+7.5%) in total operating revenue.
Local and domestic itinerant movements remain strong
In September, flight school activity at Canada's major and select small airports contributed to the increase in local movements, which rose 7.0% year over year to 168,373. The airports with the largest increases were Kitchener/Waterloo, Ontario (+3,698 movements) and Pitt Meadows, British Columbia (+2,048).
Chart 2: Total aircraft movements at major and select small airports, by class of operation
Description - Chart 2
Data table: Total aircraft movements at major and select small airports, by class of operation
Source(s): Table 23-10-0296-01.
Domestic itinerant movements totalled 326,790 in September, up 5.0% compared with the same month the previous year. This level is slightly higher (+0.4%) than the pre-COVID-19 pandemic level from September 2019, marking the first time monthly traffic for the sector has surpassed pre-pandemic levels on a year-over-year basis.
Transborder movements (to and from the United States) declined 3.5% year over year to 37,215 in September 2025. This was the sixth consecutive monthly year-over-year decrease. Meanwhile, other international movements (outside the United States) rose 6.4% from the previous year to reach 16,008 in September.
Focus on Canada and the United States
Transborder aircraft movements (to and from the United States) represented 9.8% of total itinerant movements at Canada's major and select small airports in September 2025, down from 10.6% in September 2024.
In September 2025, year-over-year declines in movements to and from the United States were recorded at all four of the largest Canadian airports: Toronto/Lester B. Pearson International (-2.3%), Vancouver International (-2.9%), Montréal/Pierre Elliot Trudeau International (-8.8%) and Calgary International (-7.6%).
Meanwhile, the number of passengers carried by Canadian Level I air carriers on scheduled transborder flights in September was 15.2% below the level recorded in the same month of 2024. This was the eighth consecutive month of year-over-year declines. Capacity of these flights, measured in available seat-kilometres, declined year over year for the sixth consecutive month in September 2025, down 12.6% from September 2024. The passenger load factor on scheduled transborder flights decreased from 79.9% in September 2024 to 75.0% in September 2025.
For more data and insights on areas touched by the socioeconomic relationship between Canada and the United States, see the Focus on Canada and the United States webpage.
Note to readers
This consolidated monthly release covers the following statistical programs:
- Aircraft movement statistics (survey number 2715, tables 23-10-0296-01 to 23-10-0304-01)
- Monthly civil aviation statistics (survey number 5026, table 23-10-0079-01).
Consult the Aviation Data Visualization Hub to explore data from Aircraft movement statistics and Monthly civil aviation statistics in an interactive format.
The aviation statistics program uses respondent (Monthly civil aviation statistics) and administrative (Aircraft movement statistics) data.
An aircraft movement is defined as a take-off, landing or simulated approach by an aircraft, as defined by NAV CANADA.
An itinerant movement is the initial take-off or the final landing of an aircraft.
A domestic itinerant movement is defined as a movement, at a Canadian airport, of an aircraft departing to or arriving from a point in Canada.
A local movement is an aircraft conducting the following airport activities: touch-and-go, stop-and-go, simulated approach without landing, low approach, pull up while on final approach or missed approach. Local movements are often carried out during training flights (touch-and-go), equipment tests, etc.
On June 2, 2025, Stephenville Airport in Newfoundland and Labrador was closed. Since June 2025, movements for Stephenville Airport are excluded from Aircraft movement statistics. Data prior to June 2025 will continue to be available.
The Monthly Civil Aviation Survey covers all Canadian Level I air carriers: Air Canada (including Air Canada Rouge), Air Transat, Flair, Jazz, Porter and WestJet (including WestJet Encore). As of June 2025, Sunwing Airlines was fully integrated into WestJet.
The average passenger trip length is calculated by dividing the number of passenger-kilometres by the number of passengers. Trips across Canada and around the world are included in this calculation.
The data in this monthly release are not seasonally adjusted.
Data are subject to revisions.
Contact information
For more information, or to enquire about the concepts, methods or data quality of this release, contact us (toll-free 1-800-263-1136; 514-283-8300; infostats@statcan.gc.ca) or Media Relations (statcan.mediahotline-ligneinfomedias.statcan@statcan.gc.ca).